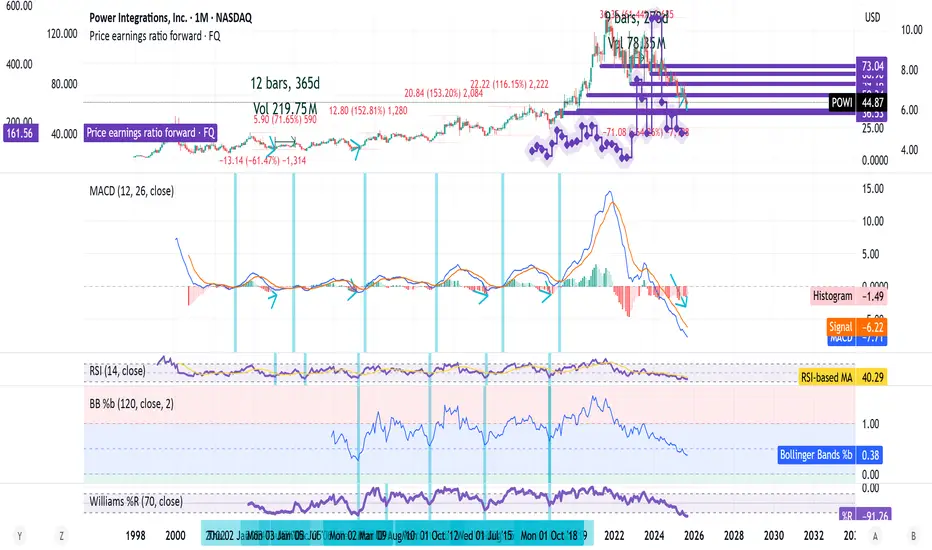
Power Integration! Everything is "Trough making" in progress!
- The relative strength index (RSI) is a momentum indicator used in technical analysis. RSI measures the speed and magnitude of a security's recent price changes to detect overbought or oversold conditions in the price of that security. The RSI is displayed as an oscillator (a line graph) on a scale of 0 to 100
- Moving average convergence/divergence (MACD) is a technical indicator that helps investors identify price trends, measure trend momentum, and identify entry points for buying or selling a security. Gerald Appel developed the MACD indicator in the 1970s, and it is still one of the most popular technical tools today.
- Moving average convergence/divergence (MACD) is a technical indicator that helps investors identify price trends, measure trend momentum, and identify entry points for buying or selling a security. Gerald Appel developed the MACD indicator in the 1970s, and it is still one of the most popular technical tools today.
Giao dịch đang hoạt động
P/E Is really high comparing it with previous troughs !P/E Forward is in a very good place, probable trough in progress !
Đóng lệnh: đạt mục tiêu
Volume has no "Spike" in it to suggest a major trough has been struck, yet the averages is pretty high which may imply a trough is in already or about to be struck !
Ghi chú
+60% in the next 10-12 Months if we rhythm with the past with everything in the universe absolute
Ghi chú
Relative to SPX, we are pretty much like 2006's low, all else in the "Universe" absolute !Ghi chú
This is the only things that is not adding up for this stock, which make me uncomfortable with it !P/E ratio is still high comparing it with other periods when we had troughs...Just compare Green circles
with Orange ones...
P/E is a fundamental analysis vs our technical analysis up there are we going to down from here to bring this P/E lower like previous troughs... Or are we going to bounce from here on a technical basis ?
Ghi chú
Ghi chú
Add the forward P/E to this chart in Blue...Still fundamentally we have room south from here ...Ghi chú
$37 is our risk down from here...Ghi chú
This is what wavebasis is suggesting as a WXY going down is finished !!! Will it turns out to be the correct count, we will never know till after the fact this is how Elliott is being analyzed from my past experience. One way to look at it out of many !Ghi chú
We have reached $39.53 from a Fibs point of view W to Y !Ghi chú
123% Fibs stands at $36.25 and we have touched $39.53 that's a $3 Dollars different from a major extension number...To conclude Elliott and technical analysis suggest Q3-Q4 is trough lands...But fundamentally P/E and Forward P/E
suggest otherwise...
what's going to be the right path from here ?
Ghi chú
P/E is sky rocketing !!!Ghi chú
116 Highest ever on record !!!Ghi chú
Lowest ever on record for the RSI with highest ever on P/E !!! What's cooking underneath the surface !!!!Ghi chú
Volume traders out there something is cooking here!!!I do more in depth studies of stocks on my twitter account. Hope you would enjoy it there as you are enjoying it here.
****** Past performance is no guarantee of future results***
twitter.com/samitrading1
****** Past performance is no guarantee of future results***
twitter.com/samitrading1
Thông báo miễn trừ trách nhiệm
The information and publications are not meant to be, and do not constitute, financial, investment, trading, or other types of advice or recommendations supplied or endorsed by TradingView. Read more in the Terms of Use.
I do more in depth studies of stocks on my twitter account. Hope you would enjoy it there as you are enjoying it here.
****** Past performance is no guarantee of future results***
twitter.com/samitrading1
****** Past performance is no guarantee of future results***
twitter.com/samitrading1
Thông báo miễn trừ trách nhiệm
The information and publications are not meant to be, and do not constitute, financial, investment, trading, or other types of advice or recommendations supplied or endorsed by TradingView. Read more in the Terms of Use.