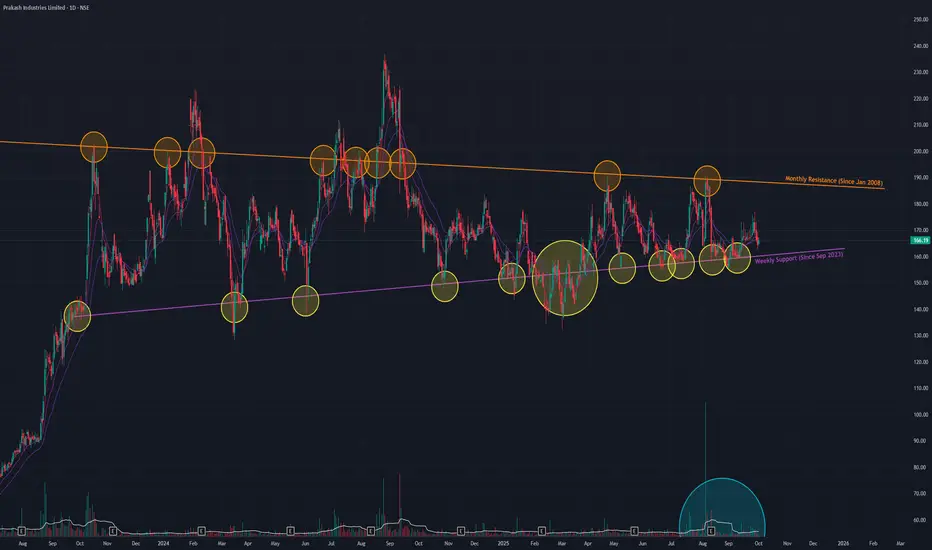
Prakash Industries is currently in a prolonged consolidation phase, trading within a large Triangle pattern that has been forming since September 2023. This pattern typically acts as a continuation of the prior trend, which in this case was a strong uptrend that began in April 2023.
The stock is now approaching the apex of this triangle, suggesting a significant price move could be imminent. The key boundaries to watch are:
- A formidable long-term resistance trendline dating back to January 2008. This level has triggered several "fake breakouts" in the past.
- A strong support trendline established since September 2023.
Outlook: A Breakout Awaits Confirmation
The stock is likely to remain range-bound in the immediate short term. A decisive move will only occur upon a breakout or breakdown from the existing pattern, which must be confirmed by a significant increase in trading volume.
- Trading Range: Within the current pattern, the stock could oscillate between the upper resistance near ₹187 and the lower support level around ₹160.
- Breakout Scenario 📈: A sustained breakout above the multi-year resistance on high volume would signal a continuation of the primary uptrend.
- Breakdown Scenario 📉: Conversely, a breakdown below the support trendline would invalidate the bullish continuation thesis and could lead to a significant correction.
Disclaimer: This analysis is my personal view & for educational purposes only. They shall not be construed as trade or investment advice. Before making any financial decision, it is imperative that you consult with a qualified financial professional.
Thông báo miễn trừ trách nhiệm
Thông tin và các ấn phẩm này không nhằm mục đích, và không cấu thành, lời khuyên hoặc khuyến nghị về tài chính, đầu tư, giao dịch hay các loại khác do TradingView cung cấp hoặc xác nhận. Đọc thêm tại Điều khoản Sử dụng.