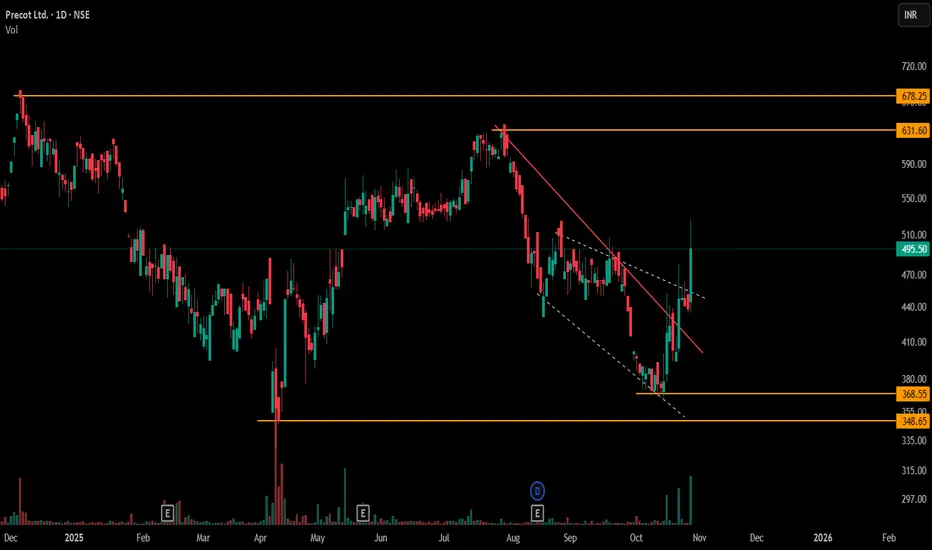
1) Sideways market action is clearly depicted here, with price oscillating between well-defined resistance and support bands (marked by orange horizontal lines). The presence of both multiple resistance and support levels typifies a range-bound environment, where relying solely on single breakout/CT patterns may lead to inconsistent observations.
2) To supplement this, a solid red counter-trendline has been drawn across recent swing highs/lows, offering a direct visual of shifting momentum pockets. In sideways phases, such counter-trendlines might limit or expand their analytical usefulness, depending on whether price respects or ignores these boundaries within the broader “box”.
3) Further, layering a secondary dotted formation—a small broadening pattern—provides additional observation reference points. Using both counter-trend and minor broadening structures together helps in mapping probable price responses at key junctions, especially when horizontal supports/resistances cluster.
4) By objectively tracking these intersections and reactions—rather than expecting a directional resolution—traders gain more nuanced insight for potential tactical responses on future moves. No forecasts here; just systematic, multi-pattern observation.
🎯 Master My Self-Made Trading Strategy
📈 Telegram (Learn Today): t.me/hashtaghammer
✅ WhatsApp (Learn Today): wa.me/919455664601
📈 Telegram (Learn Today): t.me/hashtaghammer
✅ WhatsApp (Learn Today): wa.me/919455664601
Bài đăng liên quan
Thông báo miễn trừ trách nhiệm
Thông tin và các ấn phẩm này không nhằm mục đích, và không cấu thành, lời khuyên hoặc khuyến nghị về tài chính, đầu tư, giao dịch hay các loại khác do TradingView cung cấp hoặc xác nhận. Đọc thêm tại Điều khoản Sử dụng.