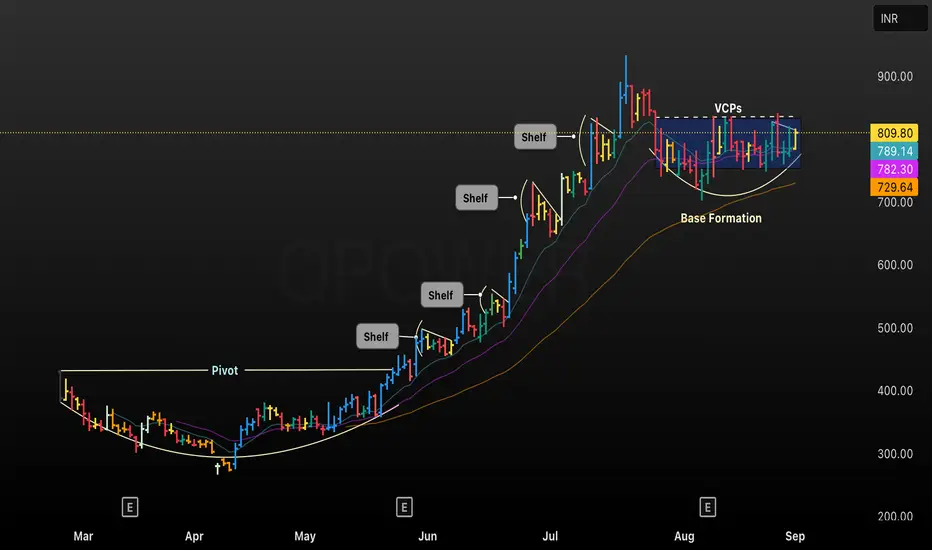
This TradingView chart of QPOWER showcases a classic growth stock progression from a Pivot breakout through multiple consolidation phases known as Shelves, indicated by horizontal pauses in price action above key moving averages. The recent price structure features a well-defined Base Formation followed by multiple VCPs (Volatility Contraction Patterns), signaling tightening price ranges and potential breakout readiness. Key moving averages are highlighted (789.14, 782.30, 729.64) to guide risk management for trend-following entries and exits.
• Technical patterns annotated: Pivot, Shelf, VCP, Base Formation
• Chart timeframe: Daily (D)
• Purpose: Used for trade decision-making and educational discussion on breakout setups and volatility contraction patterns
• Technical patterns annotated: Pivot, Shelf, VCP, Base Formation
• Chart timeframe: Daily (D)
• Purpose: Used for trade decision-making and educational discussion on breakout setups and volatility contraction patterns
Thông báo miễn trừ trách nhiệm
Thông tin và các ấn phẩm này không nhằm mục đích, và không cấu thành, lời khuyên hoặc khuyến nghị về tài chính, đầu tư, giao dịch hay các loại khác do TradingView cung cấp hoặc xác nhận. Đọc thêm tại Điều khoản Sử dụng.
Thông báo miễn trừ trách nhiệm
Thông tin và các ấn phẩm này không nhằm mục đích, và không cấu thành, lời khuyên hoặc khuyến nghị về tài chính, đầu tư, giao dịch hay các loại khác do TradingView cung cấp hoặc xác nhận. Đọc thêm tại Điều khoản Sử dụng.