Technical Analysis (1H)
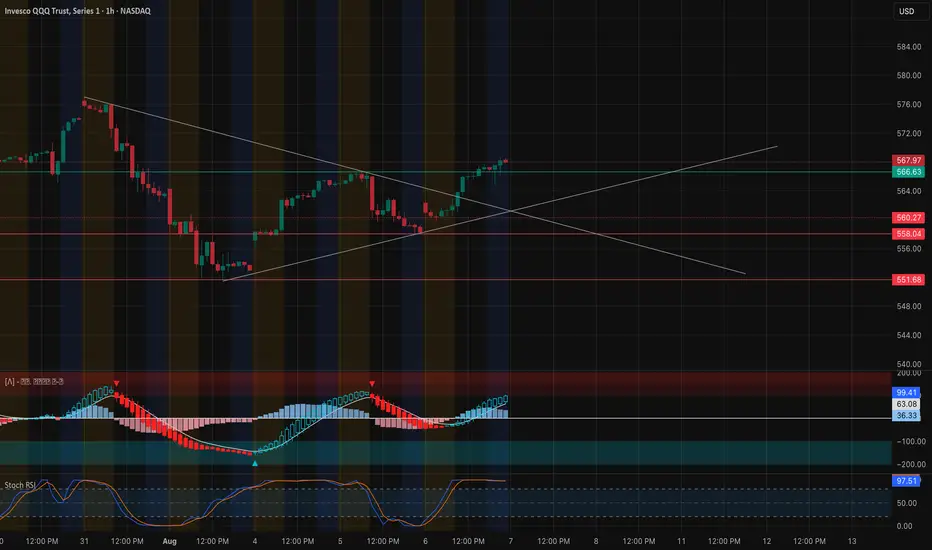
QQQ has finally broken out of the symmetrical wedge pattern, closing above the key 566–567 resistance zone and now testing the 568.60 level. This move confirms bullish momentum as the price holds above the trendline retest.
* Trendline Breakout: Clean breakout from the descending wedge with follow-through candles.
* Structure Shift: Higher lows and higher highs are forming, signaling trend reversal.
* Momentum:
* MACD: Bullish crossover with increasing histogram bars supports the breakout.
* Stoch RSI: Topped near overbought but still pointing upward — watch for potential divergence or consolidation.
* Support Zones:
* 566.60 → Retest zone from prior breakout
* 563.40 → Demand zone aligning with GEX support
* 560 → Critical support and prior resistance
* Resistance Zone:
* 568.60 → Current price testing a key rejection area from prior supply zone
If QQQ holds above 566 on retest, continuation toward 572–574 is likely. If it breaks below 563, short-term weakness may follow.
Options Sentiment & GEX Analysis

GEX data supports a tight battle zone around 567–568.
* Resistance Clusters:
* 568.63 → Highest positive NETGEX and heavy 3rd CALL wall (13.56%)
* 570–572 → GEX7 to GEX10 cluster (light resistance)
* Support Levels:
* 566 → Strong 2nd CALL Wall (15.68%)
* 563.40–564 → GEX9 and GEX8 support (cumulative ~5%)
* 560 → HVL, key pivot for downside protection
* Options Flow:
* Puts at 62.9% dominance → Contrarian bullish bias forming
* IVR 15 / IVx avg 17.9% → Low implied volatility; premium buyers are favored
* GEX 0% → Neutral gamma pressure, so price can move more freely with volume
This GEX structure shows call walls above, but strong net gamma support below. If bulls hold 566–567, they can attempt a push toward 572 into mid-August expiration.
Conclusion: Bulls are in control above 566. As long as QQQ holds that breakout zone, upside momentum could target 572+. A breakdown back below 563 opens up downside back to 560 or lower. Watch for volume confirmation and IV expansion.
Disclaimer: This analysis is for educational purposes only and does not constitute financial advice. Always do your own research and manage risk accordingly.
QQQ has finally broken out of the symmetrical wedge pattern, closing above the key 566–567 resistance zone and now testing the 568.60 level. This move confirms bullish momentum as the price holds above the trendline retest.
* Trendline Breakout: Clean breakout from the descending wedge with follow-through candles.
* Structure Shift: Higher lows and higher highs are forming, signaling trend reversal.
* Momentum:
* MACD: Bullish crossover with increasing histogram bars supports the breakout.
* Stoch RSI: Topped near overbought but still pointing upward — watch for potential divergence or consolidation.
* Support Zones:
* 566.60 → Retest zone from prior breakout
* 563.40 → Demand zone aligning with GEX support
* 560 → Critical support and prior resistance
* Resistance Zone:
* 568.60 → Current price testing a key rejection area from prior supply zone
If QQQ holds above 566 on retest, continuation toward 572–574 is likely. If it breaks below 563, short-term weakness may follow.
Options Sentiment & GEX Analysis
GEX data supports a tight battle zone around 567–568.
* Resistance Clusters:
* 568.63 → Highest positive NETGEX and heavy 3rd CALL wall (13.56%)
* 570–572 → GEX7 to GEX10 cluster (light resistance)
* Support Levels:
* 566 → Strong 2nd CALL Wall (15.68%)
* 563.40–564 → GEX9 and GEX8 support (cumulative ~5%)
* 560 → HVL, key pivot for downside protection
* Options Flow:
* Puts at 62.9% dominance → Contrarian bullish bias forming
* IVR 15 / IVx avg 17.9% → Low implied volatility; premium buyers are favored
* GEX 0% → Neutral gamma pressure, so price can move more freely with volume
This GEX structure shows call walls above, but strong net gamma support below. If bulls hold 566–567, they can attempt a push toward 572 into mid-August expiration.
Conclusion: Bulls are in control above 566. As long as QQQ holds that breakout zone, upside momentum could target 572+. A breakdown back below 563 opens up downside back to 560 or lower. Watch for volume confirmation and IV expansion.
Disclaimer: This analysis is for educational purposes only and does not constitute financial advice. Always do your own research and manage risk accordingly.
Thông báo miễn trừ trách nhiệm
Thông tin và ấn phẩm không có nghĩa là và không cấu thành, tài chính, đầu tư, kinh doanh, hoặc các loại lời khuyên hoặc khuyến nghị khác được cung cấp hoặc xác nhận bởi TradingView. Đọc thêm trong Điều khoản sử dụng.
Thông báo miễn trừ trách nhiệm
Thông tin và ấn phẩm không có nghĩa là và không cấu thành, tài chính, đầu tư, kinh doanh, hoặc các loại lời khuyên hoặc khuyến nghị khác được cung cấp hoặc xác nhận bởi TradingView. Đọc thêm trong Điều khoản sử dụng.