When price moves from below to above an AVWAP decisively, it signals short covering & a shift in control from sellers to buyers & when 2 or more AVWAPs converge liquidity concentrates, reversals or breakouts often happen there & these are the spots where traders take reversal trades, breakout entries, or stop placements
1. Using AVWAPs as a dynamic stop-loss is one of the simplest & most effective uses
2. An AVWAP is a useful trend filter
3. AVWAP + candlesticks = clean entry signals
As a high-level playbook, anchor VWAPs at major pivots (highs, lows, breakdowns, earnings gaps), trade pullbacks into rising AVWAPs during uptrends & trade rejects from falling AVWAPs in downtrends
Price is above all AVWAPs
The ATH AVWAP is rising & firmly below price
The 3 & 21 November AVWAP are now support layers
Now that price is above all 3 major AVWAPs, the focus shifts to behavior around the ATH AVWAP & since price is above it already, there are only 2 meaningful reads
1. Bullish continuation setup
2. Price may pull back to the ATH AVWAP ($618)
Potential warning setup because trend deterioration begins with this move
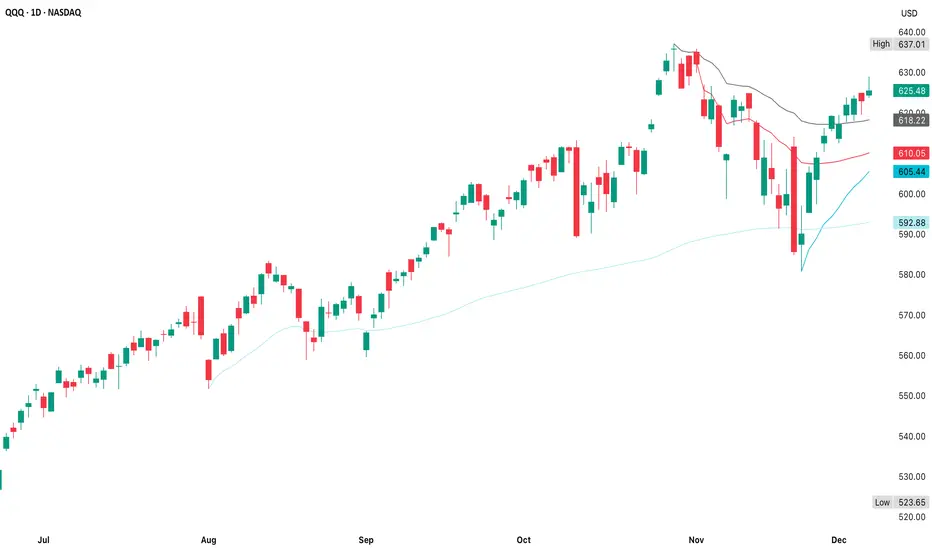
The chart shows the exact 3 level anchored VWAP system that institutional traders use
This lets you map out short-term trend control (blue), intermediate-term supply absorption (red) & higher-timeframe trend health (gray) & right now, all of them say the same thing
ATH AVWAP
3 November breakdown AVWAP
21 Nov AVWAP - capitulation
Long-Term AVWAP
When all layers are stacked in ascending order like this, you get a fully aligned bull structure, clean pullback architecture, no overhead VWAP resistance, multi-cohort profit alignment & strong continuation behavior
These levels come directly from how institutions trade AVWAPs
1. ATH AVWAP (~$618) is the light pullback, common after a fast push off a low
2. 3 November AVWAP (~$610)
3. 21 November AVWAP (~$605)
4. Long-Term AVWAP (~$592)
Given the current AVWAP spacing & slope
- Right now, the 3 & 21 November AVWAPs are separated, meaning trend strength
- When they converge, it signals compression
1. Using AVWAPs as a dynamic stop-loss is one of the simplest & most effective uses
- If you're long above the 21 November AVWAP, the rising blue AVWAP is your dynamic stop
- A close below it should signal an exit
- It reflects the average buyer cost basis, not arbitrary price levels
2. An AVWAP is a useful trend filter
- Price above rising AVWAP(s) suggests a long bias
- Price below falling AVWAP(s) suggests short bias
- When price chops around a flattening AVWAP, stay out
- AVWAP is a trend health indicator
3. AVWAP + candlesticks = clean entry signals
- The strongest signals come when price pulls back into an AVWAP, prints a small reversal candle (hammer, doji, engulfing) & ATR is declining (just like now) since these become high-quality continuation entries
As a high-level playbook, anchor VWAPs at major pivots (highs, lows, breakdowns, earnings gaps), trade pullbacks into rising AVWAPs during uptrends & trade rejects from falling AVWAPs in downtrends
- Use converging AVWAPs as inflection points
- Use the nearest rising AVWAP as your stop
- Anchor to the close if the candle represents an event you want to capture (breakout, breakdown, a clear reversal bar, a candle where closing price indicates the market's verdict, earnings, FOMC, etc)
- Anchor to (H+L+C)/3 (the “typical price”) when you want a smoothed, less-biased VWAP for longer-term structures or swings
Typical price reduces noice from intraday spikes & avoids sensitivity to one extreme print or over-reaction to the tails on the candle (AVWAP from swing highs/lows or the start of a trend)
Price is above all AVWAPs
- This means all meaningful “cost basis cohorts” are beneath price
- The market is structurally repaired, at least in volume-weighted terms
- Overhead resistance from anchored supply does not exist right now
- This is a very different situation from when AVWAPs are stacked above price
The ATH AVWAP is rising & firmly below price
- This is one of the best signs of long-term trend health in AVWAP analysis
- When the ATH AVWAP is rising, decisively reclaimed & acting as near-term support, it usually tells you the prior correction has been fully absorbed
- Longs from the top are no longer underwater
- Selling pressure from those prior buyers is neutralized
- Trend followers using AVWAP logic have flipped their filters back to “risk-on”
- This is an objective, mathematical read & not a prediction
The 3 & 21 November AVWAP are now support layers
- 3 November (red) are breakdown-day sellers who are now underwater & this is a bullish dynamic because they can’t apply pressure
- 21 Nov (blue) are capitulation low buyers, still profitable & in control - primary support
- Together, these form a layered support around $605-$612, or the area where dip-buyers have historically stepped-in
- A stop-loss location for AVWAP-based trading systems
Now that price is above all 3 major AVWAPs, the focus shifts to behavior around the ATH AVWAP & since price is above it already, there are only 2 meaningful reads
1. Bullish continuation setup
2. Price may pull back to the ATH AVWAP ($618)
- Find buyers (hammer, doji, small-range reversal) & then move away
- This is one of Brian Shannon’s highest-probability setups (reclaim AVWAP → pullback → higher low → continuation)
Potential warning setup because trend deterioration begins with this move
- Price closes below the ATH AVWAP
- Then stays below it for multiple sessions
- Slope begins to flatten or roll over
- This would be your first objective sign that the trend is losing strength from an anchored-volume standpoint
The chart shows the exact 3 level anchored VWAP system that institutional traders use
- A correction-low AVWAP (21 November)
- A breakdown-event AVWAP (3 November)
- A structural high AVWAP (ATH)
This lets you map out short-term trend control (blue), intermediate-term supply absorption (red) & higher-timeframe trend health (gray) & right now, all of them say the same thing
- Price is in a state of repaired, orderly trend with all major AVWAPs providing support beneath
ATH AVWAP
- Defines trend health at the highest timeframe visible on your chart
- Swing traders, late buyers at the highs, trend-following algos
- When price is above the ATH AVWAP then the uptrend is structurally intact
- When price is below it then long-term players are underwater, trend is suspect
- QQQ is above the ATH AVWAP (~$618)
- This means that ATH buyers are profitable again
- The first high-quality pullback often tags this line in early trend repair phases
- A reclaim → retest → hold sequence is extremely bullish behavior
3 November breakdown AVWAP
- Tracks sellers from major breakdowns or panic candles
- Funds that sold into weakness, systematic risk-off flows
- If price is above it then that entire selling cohort is underwater
- These traders become forced buyers on pullbacks or breakouts
- AVWAP ~$610
- Price is above it then supply from that breakdown is absorbed
- This AVWAP becomes support on deeper pullbacks
- If price tags it then watch for immediate dip-buying
21 Nov AVWAP - capitulation
- Tracks the cost basis of buyers who stepped in at the emotional low
- Aggressive reversal traders, deep-value algos, CTA re-leveraging
- This is the most important rising support line in the model
- When price is above it, the reversal cohort is still in control
- A close below it often signals trend exhaustion
- AVWAP ~$605
- Price is well above it & the slope is rising aggressively
- As long as price respects this AVWAP, the recovery trend remains clean
- If price pulls back to it then this is a high-odds rotation/continuation buy point
Long-Term AVWAP
- This is the long rising AVWAP on your chart (~$592)
- It acts as deep trend support
- The line separating bull vs bear structure
- The highest timeframe “fair value” of the entire trend leg
- A tag here marks trend reset, not breakdown
- A break below this layer shifts the market into caution
- This long AVWAP is safely under price so the long-cycle trend remains intact
When all layers are stacked in ascending order like this, you get a fully aligned bull structure, clean pullback architecture, no overhead VWAP resistance, multi-cohort profit alignment & strong continuation behavior
- This model is about control, not prediction & right now, the bullish alignment is simply a fact of structure
These levels come directly from how institutions trade AVWAPs
1. ATH AVWAP (~$618) is the light pullback, common after a fast push off a low
- Signals to watch for include a hammer/doji at the AVWAP
- Lower wick rejection
- ATR contraction & reversal
- Reclaim → hold → push
- This is the first layer most swing traders buy
2. 3 November AVWAP (~$610)
- This is the mid-depth pullback
- It’s usually triggered when short-term longs trim
- Expect a strong buyer reaction
- 1-2 days of stabilizing candles
- Momentum traders stepping back in
- This is a very strong continuation level in AVWAP systems
3. 21 November AVWAP (~$605)
- This is the high-value dip
- This line is VWAP traders’ favorite
- It represents the true reversal cohort’s cost basis
- It has been respected perfectly
- It rises steadily each day
- It marks the “line of trend continuation”
- If price reaches this AVWAP, this is often the highest-probability buy in the entire structure
- Rejecting here = trend continuation
- Closing below = trend fatigue
4. Long-Term AVWAP (~$592)
- This is the deep reset, not a casual dip
- If price ever hits this momentum is gone, trend is resetting, higher timeframe traders reassess, hedge funds rotate & isk allocation shifts
- This is not a breakdown, but it is a significant tone-change
- You rarely see this tested unless markets enter a broader digestion phase
Given the current AVWAP spacing & slope
- $618 (ATH AVWAP) is highly actionable
- $610 (3 November AVWAP) is a strong level
- $605 (21 November AVWAP) is an institutional-grade support
- When price is above all 3, VWAP traders don’t look for tops - they monitor control transitions
I am not a licensed professional & these posts are for informational purposes only, not financial advice.
Thông báo miễn trừ trách nhiệm
Thông tin và các ấn phẩm này không nhằm mục đích, và không cấu thành, lời khuyên hoặc khuyến nghị về tài chính, đầu tư, giao dịch hay các loại khác do TradingView cung cấp hoặc xác nhận. Đọc thêm tại Điều khoản Sử dụng.