In my last idea on the Annual outlook for SPY, I indicated we would likely start the year off bearish, which has so far proved correct.
The alternative was a continuation up to high targets, but generally when we open the year closer to the high targets, it usually leads to a sell.
SPY has been slow to sell, but QQQ has been quick to sell.
Most likely explanation there is, there was major bullish positioning by small and large speculators on NQ1! (at historically high levels in fact) and major bearish positioning on ES1!.
As tech hit the ground running bearish, it likely is leading to massive long coverings which, as with short covering, creates an inverse short squeeze (Long Squeeze), where longs are covering which adds to the dramatic tumble of the future/index.
Unlike ES where everyone was mostly already positioned short, so there is no added pressure on SPY to go down.
As well, NQ/tech needed a larger correction owning to its more aggressive run up.
How much further down is the question but I can tell you its likely we haven't bottomed quite yet.
Daily volume still signaling a top on NQ, ES and SPX.
We are still over-extended on the daily timeframe.
If we look at a simple autoregressed Model of QQQ, SPY, NQ1! and ES1! we can see really what is likely to happen:
NQ1!:

ES1!:

SPY:

QQQ:

And just for perspective, let's look at QQQ on the weekly:

We need to, at the very least, retrace the centre-line of the autoregressed clouds.
Even in 2021, there were frequent retracements of this line:

Whether we go below the centreline on the weekly (we are already there on the daily) is a matter of question, but we can use some other tools to help us figure it out. For example, if we look at the 3 month levels on QQQ:

We have broken below the threshold indicating a move to 385 is likely, which also aligns with our Autoregressed cloud target.
We do have that bullish GT there, but you know, we have three months to hit it, so we really need to finish the pullback into the low range of these 3 month clouds and then we can start the recovery back up. The fast we tank, the faster we can start recovery.
For SPY:

Already shared this, but here it is again. Still has a ways to go to even just break down from the bearish threshold, but its working its way.
Your immediate target on SPY should be a move to 466.
Immediate target on QQQ should be a move towards 391.
QQQ has broken down the SMA on the autoregression clouds and this can sometimes lead to a period of consolidation before continuation. Here is an example:

My ideal place to begin my long entries is a move to the 3 month low targets. This would be fantastic and a great R:R for some major upside action.
Remember, we spent like 1 month going straight up. The indices need time to sort their S**T out, conslidate, pullback, stabilize, shakeout everyone and then continue with its overal prerogative.
My opinion, and solely my opinion and not advice is this:
1) Too early to build a long swing position,
2) Still time to build a small short swing position assuming either long dated options or shares,
3) Too late to do short term options in either direction.
Those are my thoughts, I will maybe stick to updating this idea into next week.
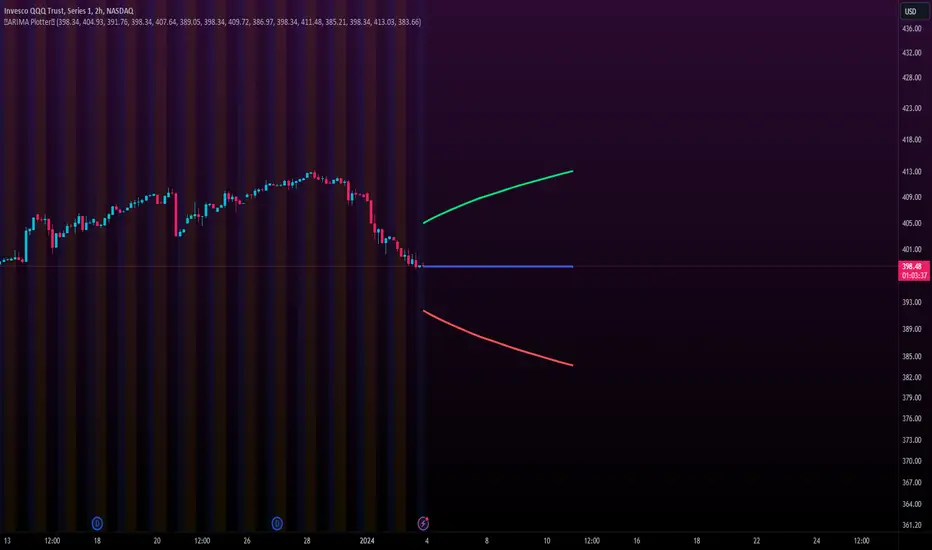
I have also included the next 5 day ARIMA Forecast in the main chart on QQQ.
The outer bands are the 80% confidence levels up and down. We should remain confined within these bands over the next 5 days. I have aligned them with the 5 day period on the chart.
(Side note, when I started trading with math I would trade exclusively ARIMA Forecasts and bell curve levels, then that was replaced with RPPIs and my own models, but another resolution this year is to re-include ARIMA because its very helpful and its also what big market makers use themselves, so I will be including the confidence levels and ARIMA levels in future ideas!).
Those are my thoughts! Thanks for reading, Trade safe and take care!
One thing I forgot to add, if we were to trade solely the Heikin Ashi setup, the retracement level is here:

Which also corresponds to a gap close on NQ.
However, this setup does not exist on ES.
Very curious.
The alternative was a continuation up to high targets, but generally when we open the year closer to the high targets, it usually leads to a sell.
SPY has been slow to sell, but QQQ has been quick to sell.
Most likely explanation there is, there was major bullish positioning by small and large speculators on NQ1! (at historically high levels in fact) and major bearish positioning on ES1!.
As tech hit the ground running bearish, it likely is leading to massive long coverings which, as with short covering, creates an inverse short squeeze (Long Squeeze), where longs are covering which adds to the dramatic tumble of the future/index.
Unlike ES where everyone was mostly already positioned short, so there is no added pressure on SPY to go down.
As well, NQ/tech needed a larger correction owning to its more aggressive run up.
How much further down is the question but I can tell you its likely we haven't bottomed quite yet.
Daily volume still signaling a top on NQ, ES and SPX.
We are still over-extended on the daily timeframe.
If we look at a simple autoregressed Model of QQQ, SPY, NQ1! and ES1! we can see really what is likely to happen:
NQ1!:
ES1!:
SPY:
QQQ:
And just for perspective, let's look at QQQ on the weekly:
We need to, at the very least, retrace the centre-line of the autoregressed clouds.
Even in 2021, there were frequent retracements of this line:
Whether we go below the centreline on the weekly (we are already there on the daily) is a matter of question, but we can use some other tools to help us figure it out. For example, if we look at the 3 month levels on QQQ:
We have broken below the threshold indicating a move to 385 is likely, which also aligns with our Autoregressed cloud target.
We do have that bullish GT there, but you know, we have three months to hit it, so we really need to finish the pullback into the low range of these 3 month clouds and then we can start the recovery back up. The fast we tank, the faster we can start recovery.
For SPY:
Already shared this, but here it is again. Still has a ways to go to even just break down from the bearish threshold, but its working its way.
Your immediate target on SPY should be a move to 466.
Immediate target on QQQ should be a move towards 391.
QQQ has broken down the SMA on the autoregression clouds and this can sometimes lead to a period of consolidation before continuation. Here is an example:
My ideal place to begin my long entries is a move to the 3 month low targets. This would be fantastic and a great R:R for some major upside action.
Remember, we spent like 1 month going straight up. The indices need time to sort their S**T out, conslidate, pullback, stabilize, shakeout everyone and then continue with its overal prerogative.
My opinion, and solely my opinion and not advice is this:
1) Too early to build a long swing position,
2) Still time to build a small short swing position assuming either long dated options or shares,
3) Too late to do short term options in either direction.
Those are my thoughts, I will maybe stick to updating this idea into next week.
I have also included the next 5 day ARIMA Forecast in the main chart on QQQ.
The outer bands are the 80% confidence levels up and down. We should remain confined within these bands over the next 5 days. I have aligned them with the 5 day period on the chart.
(Side note, when I started trading with math I would trade exclusively ARIMA Forecasts and bell curve levels, then that was replaced with RPPIs and my own models, but another resolution this year is to re-include ARIMA because its very helpful and its also what big market makers use themselves, so I will be including the confidence levels and ARIMA levels in future ideas!).
Those are my thoughts! Thanks for reading, Trade safe and take care!
One thing I forgot to add, if we were to trade solely the Heikin Ashi setup, the retracement level is here:
Which also corresponds to a gap close on NQ.
However, this setup does not exist on ES.
Very curious.
Ghi chú
Its likely the indices are going to whipsaw like mad.If you are looking for something that seems a bit stronger and more convincing, NVDA looks like a pretty solid long, provided it holds the threshold levels:
Ghi chú
So SPY took out the 466, and QQQ is working its way very close to 391. Here are the levels for SPY today:
Safe trades!
Ghi chú
If your interested in NVDA again, There may be an initial pulse up to PH1, but its likely we should see retracement back to the conditionals.
Ghi chú
You're*Get:
- Live Updates,
- Discord access,
- Access to my Proprietary Merlin Software,
- Access to premium indicators,
patreon.com/steversteves
Now on X!
- Live Updates,
- Discord access,
- Access to my Proprietary Merlin Software,
- Access to premium indicators,
patreon.com/steversteves
Now on X!
Thông báo miễn trừ trách nhiệm
Thông tin và ấn phẩm không có nghĩa là và không cấu thành, tài chính, đầu tư, kinh doanh, hoặc các loại lời khuyên hoặc khuyến nghị khác được cung cấp hoặc xác nhận bởi TradingView. Đọc thêm trong Điều khoản sử dụng.
Get:
- Live Updates,
- Discord access,
- Access to my Proprietary Merlin Software,
- Access to premium indicators,
patreon.com/steversteves
Now on X!
- Live Updates,
- Discord access,
- Access to my Proprietary Merlin Software,
- Access to premium indicators,
patreon.com/steversteves
Now on X!
Thông báo miễn trừ trách nhiệm
Thông tin và ấn phẩm không có nghĩa là và không cấu thành, tài chính, đầu tư, kinh doanh, hoặc các loại lời khuyên hoặc khuyến nghị khác được cung cấp hoặc xác nhận bởi TradingView. Đọc thêm trong Điều khoản sử dụng.