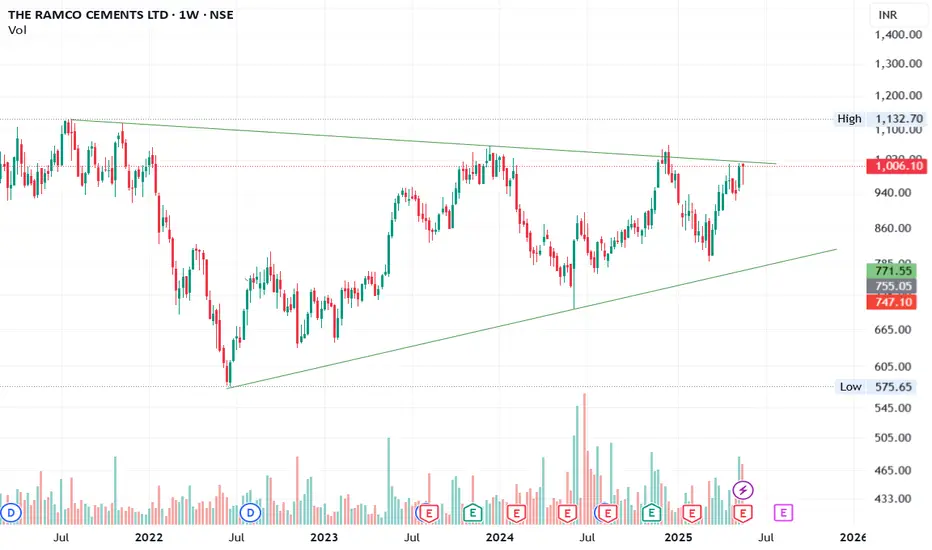
📌 Chart: Weekly | Symbol: NSE:RAMCOCEM
Ramco Cements is testing the upper resistance of a multi-year symmetrical triangle that has been forming since mid-2021. This type of consolidation often precedes a major breakout or breakdown, and we’re now at a critical decision point.
💡 Key Observations:
Price is coiling near the triangle apex — a breakout above ₹1,020 could lead to a strong momentum move.
Multiple attempts to break the upper trendline show building pressure.
Volume has started to pick up on green candles — early signs of accumulation?
Weekly RSI trending higher, signaling strength.
📈 Levels to Watch:
Breakout Zone: ₹1,010–₹1,020
Target Zones: ₹1,150 → ₹1,250+ (if breakout sustains)
Support: ₹930 (short-term), ₹870 (pattern base)
🧠 Bias: Bullish on breakout confirmation
⏳ Strategy: Wait for a close above ₹1,020 with volume. Keep SL below last swing low.
Thông báo miễn trừ trách nhiệm
Thông tin và các ấn phẩm này không nhằm mục đích, và không cấu thành, lời khuyên hoặc khuyến nghị về tài chính, đầu tư, giao dịch hay các loại khác do TradingView cung cấp hoặc xác nhận. Đọc thêm tại Điều khoản Sử dụng.
Thông báo miễn trừ trách nhiệm
Thông tin và các ấn phẩm này không nhằm mục đích, và không cấu thành, lời khuyên hoặc khuyến nghị về tài chính, đầu tư, giao dịch hay các loại khác do TradingView cung cấp hoặc xác nhận. Đọc thêm tại Điều khoản Sử dụng.