📈 1-Hour Intraday Technical Overview
Based on the latest intraday data, here's a snapshot of RAMKY's performance:
Current Price: ₹687.10
Daily Range: ₹594.40 – ₹705.00
Volume: Approximately 6.4 million shares
RSI (Relative Strength Index): 73.06 (indicating overbought conditions)
MACD (Moving Average Convergence Divergence): 11.03 (bullish momentum)
ADX (Average Directional Index): 23.81 (moderate trend strength)
Supertrend Indicator: ₹560.31 (suggesting an upward trend)
Parabolic SAR: ₹557.45 (supporting bullish trend)
Rate of Change (ROC): 14.39% (indicating strong momentum)
Chaikin Money Flow (CMF): 0.358 (positive accumulation)
Williams %R: -12.13 (approaching overbought territory)
Stochastic Oscillator: 36.47 (neutral, with potential for upward movement)
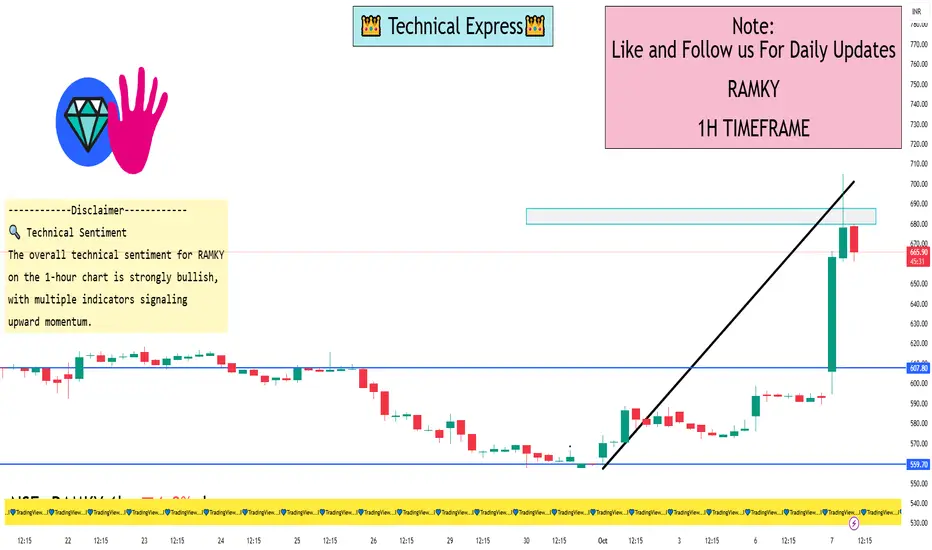
🔍 Technical Sentiment
The overall technical sentiment for RAMKY on the 1-hour chart is strongly bullish, with multiple indicators signaling upward momentum. However, the high RSI suggests that the stock may be approaching overbought levels, indicating a potential for short-term consolidation or pullback.
Based on the latest intraday data, here's a snapshot of RAMKY's performance:
Current Price: ₹687.10
Daily Range: ₹594.40 – ₹705.00
Volume: Approximately 6.4 million shares
RSI (Relative Strength Index): 73.06 (indicating overbought conditions)
MACD (Moving Average Convergence Divergence): 11.03 (bullish momentum)
ADX (Average Directional Index): 23.81 (moderate trend strength)
Supertrend Indicator: ₹560.31 (suggesting an upward trend)
Parabolic SAR: ₹557.45 (supporting bullish trend)
Rate of Change (ROC): 14.39% (indicating strong momentum)
Chaikin Money Flow (CMF): 0.358 (positive accumulation)
Williams %R: -12.13 (approaching overbought territory)
Stochastic Oscillator: 36.47 (neutral, with potential for upward movement)
🔍 Technical Sentiment
The overall technical sentiment for RAMKY on the 1-hour chart is strongly bullish, with multiple indicators signaling upward momentum. However, the high RSI suggests that the stock may be approaching overbought levels, indicating a potential for short-term consolidation or pullback.
I built a Buy & Sell Signal Indicator with 85% accuracy.
📈 Get access via DM or
WhatsApp: wa.link/d997q0
Contact - +91 76782 40962
| Email: techncialexpress@gmail.com
| Script Coder | Trader | Investor | From India
📈 Get access via DM or
WhatsApp: wa.link/d997q0
Contact - +91 76782 40962
| Email: techncialexpress@gmail.com
| Script Coder | Trader | Investor | From India
Bài đăng liên quan
Thông báo miễn trừ trách nhiệm
Thông tin và các ấn phẩm này không nhằm mục đích, và không cấu thành, lời khuyên hoặc khuyến nghị về tài chính, đầu tư, giao dịch hay các loại khác do TradingView cung cấp hoặc xác nhận. Đọc thêm tại Điều khoản Sử dụng.