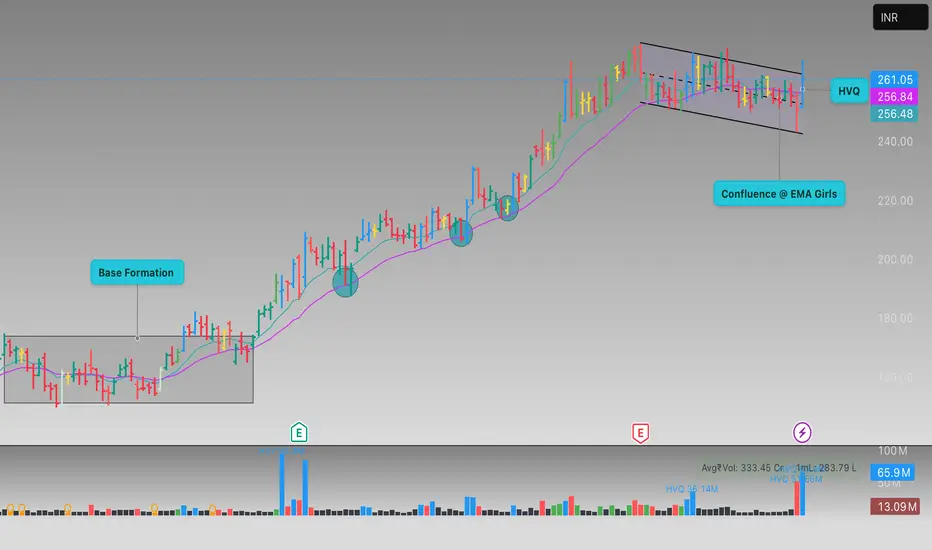
This TradingView chart displays the daily candlestick price movement of RBLBANK in INR, highlighting important technical patterns and zones. The chart features a “Base Formation” region, an upward breakout followed by steady bullish momentum, and a consolidation phase (flag channel) at higher levels. Key technical elements include two Exponential Moving Averages (EMAs), support and resistance zones, and high volume clusters (HVQ) indicating significant trading activity. Annotations such as “Confluence @ EMA” and volume bars further assist in identifying potential entry and exit points for traders.
Thông báo miễn trừ trách nhiệm
Thông tin và ấn phẩm không có nghĩa là và không cấu thành, tài chính, đầu tư, kinh doanh, hoặc các loại lời khuyên hoặc khuyến nghị khác được cung cấp hoặc xác nhận bởi TradingView. Đọc thêm trong Điều khoản sử dụng.
Thông báo miễn trừ trách nhiệm
Thông tin và ấn phẩm không có nghĩa là và không cấu thành, tài chính, đầu tư, kinh doanh, hoặc các loại lời khuyên hoặc khuyến nghị khác được cung cấp hoặc xác nhận bởi TradingView. Đọc thêm trong Điều khoản sử dụng.