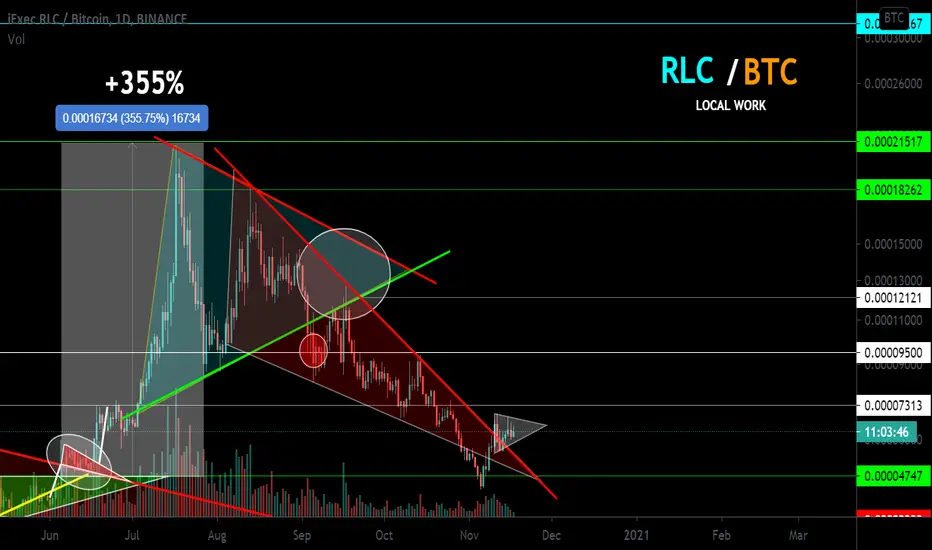
I have been accompanying the movement of this coin since the beginning of the inception of the last uptrend (pump more than + 400%). Also the entire downward movement of the subsequent trend. Under the description of the idea, I secured all the trading ideas for this coin published on this resource for open access in which I accompanied the price from the inception of an uptrend and its reversal and change to a downtrend.
At the moment, the long buy level (zone) has been reached (green level). There was a rebound from it. At the moment, the breakdown of the wedge resistance. A local triangle is drawn in the breakout zone; there is a possibility that it will act as a canvas of an upward pennant in cases of price fixation above the wedge resistance.
At the moment, the long buy level (zone) has been reached (green level). There was a rebound from it. At the moment, the breakdown of the wedge resistance. A local triangle is drawn in the breakout zone; there is a possibility that it will act as a canvas of an upward pennant in cases of price fixation above the wedge resistance.
Ghi chú
Ghi chú
Ghi chú

Ghi chú
Ghi chú
Ghi chú
Ghi chú
Ghi chú

I will add on my own. An ordinary trader of the "hamster level" with such pumping should not buy, but sell, regardless of where the price will go next.
Ghi chú
✅ Telegram. Finance + Trading: t.me/SpartaBTC_1318
✅ Telegram. Сrypto trading only: t.me/SpartaBTC_tradingview
✅ Instagram: instagram.com/spartabtc_1318
✅ YouTube (Rus): goo.su/vpRzRa2
✅ Telegram. Сrypto trading only: t.me/SpartaBTC_tradingview
✅ Instagram: instagram.com/spartabtc_1318
✅ YouTube (Rus): goo.su/vpRzRa2
Bài đăng liên quan
Thông báo miễn trừ trách nhiệm
Thông tin và ấn phẩm không có nghĩa là và không cấu thành, tài chính, đầu tư, kinh doanh, hoặc các loại lời khuyên hoặc khuyến nghị khác được cung cấp hoặc xác nhận bởi TradingView. Đọc thêm trong Điều khoản sử dụng.