Giá lên
Look at this and ask yourself what would you do...
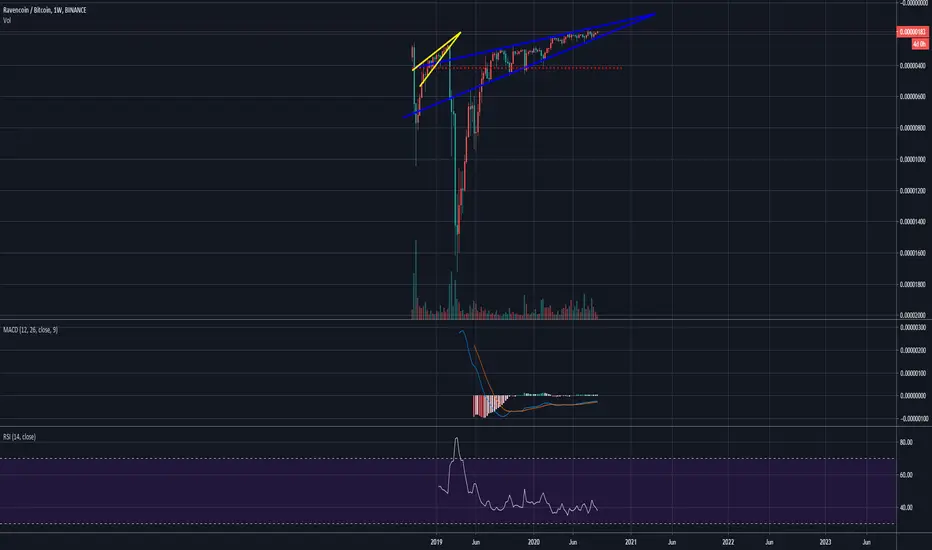
Here's the RVN chart. Inverted. Would you ever go long on a chart pattern like this? Who in their right mind would go long on a chart pattern like this? This looks absolutely horrific. Now let's remember, this chart is inverted. So if you saw this on something like say, BTC, you would probably start screaming, OH NO IT'S GOING TO 0! hahaha... ah yes, patience is key here. This chart pattern is too good to pass up. Buy the dip. Ride the moves out. Wait for the breakout.
The range is getting tighter and tighter, it's only a matter of time before this gets the reversal that it's hinting at. 100% move minimum upon breakout. Market makers don't care for fundamentals. Don't look for a 'reason', the chart is the reason. If this doesn't ever reverse to all time highs, I will say that I would be extremely shocked.
Oh yeah, and don't forget the tight range on the RSI which is slowly making higher lows, and the slim slim histogram of the MACD indicating small insignificant movements in price.
Thông báo miễn trừ trách nhiệm
Thông tin và các ấn phẩm này không nhằm mục đích, và không cấu thành, lời khuyên hoặc khuyến nghị về tài chính, đầu tư, giao dịch hay các loại khác do TradingView cung cấp hoặc xác nhận. Đọc thêm tại Điều khoản Sử dụng.
Thông báo miễn trừ trách nhiệm
Thông tin và các ấn phẩm này không nhằm mục đích, và không cấu thành, lời khuyên hoặc khuyến nghị về tài chính, đầu tư, giao dịch hay các loại khác do TradingView cung cấp hoặc xác nhận. Đọc thêm tại Điều khoản Sử dụng.