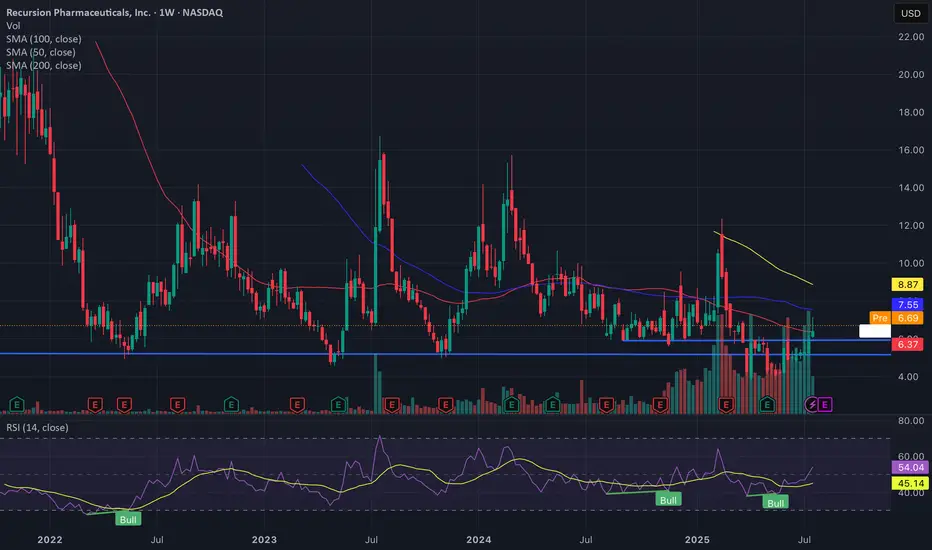
In my previous post yesterday I mentioned the multi year lower support line, the chart on that post was on a much shorter timeframe and didn’t show the support level that I talked about so I thought I’d publish this weekly chart to illustrate what I was talking about.
I also forgot to mention the large increase in the volume of shares traded over the last couple of weeks, this reflects the increase in interest in the company and is generally a positive sign when price is rising as is the case right now.
Pre market is currently indicating a strong opening up 6%, adding to yesterdays gains.
As mentioned yesterday I believe the stock will continue to advance strongly in the coming weeks and months
Thông báo miễn trừ trách nhiệm
Thông tin và ấn phẩm không có nghĩa là và không cấu thành, tài chính, đầu tư, kinh doanh, hoặc các loại lời khuyên hoặc khuyến nghị khác được cung cấp hoặc xác nhận bởi TradingView. Đọc thêm trong Điều khoản sử dụng.
Thông báo miễn trừ trách nhiệm
Thông tin và ấn phẩm không có nghĩa là và không cấu thành, tài chính, đầu tư, kinh doanh, hoặc các loại lời khuyên hoặc khuyến nghị khác được cung cấp hoặc xác nhận bởi TradingView. Đọc thêm trong Điều khoản sử dụng.