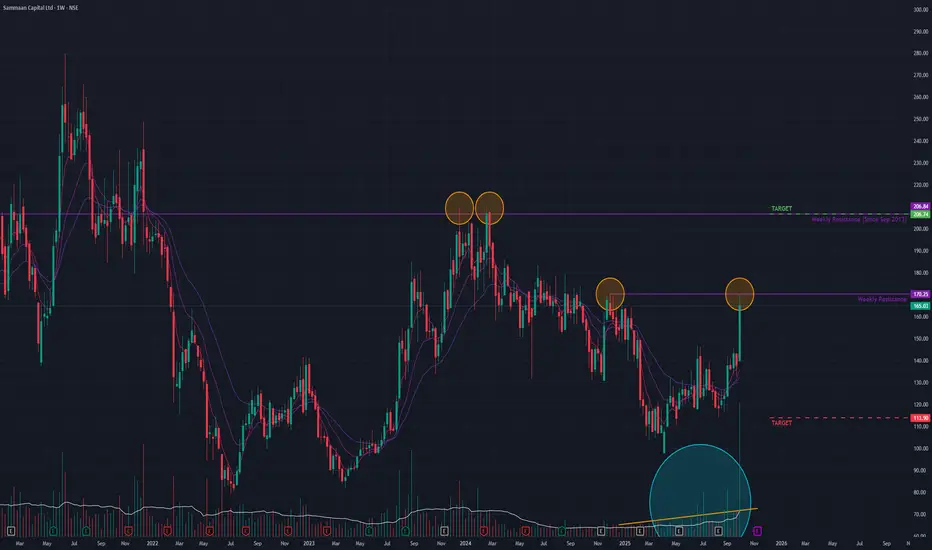
After a prolonged downtrend that began in August 2018, Sammaan Capital transitioned into a sideways consolidation phase starting in March 2020.
Recently, the stock has shown significant bullish intent. Last week, it surged by +19.74%, accompanied by an exceptionally high volume spike of 462.74 million shares. This powerful move brought the price to the brink of breaking out from a key short-term resistance trendline.
Several technical indicators support a bullish outlook:
- Moving Averages: The short-term Exponential Moving Averages (EMAs) are in a state of positive crossover on both the monthly and weekly timeframes.
- Momentum: The Relative Strength Index (RSI) has also registered a positive crossover on both timeframes, signaling strong upward momentum.
- Volume: A steady increase in average volume suggests growing buyer interest.
Future Outlook:
The stock's direction hinges on its ability to overcome the immediate resistance.
- Bullish Scenario: If the current momentum is sustained and the stock achieves a decisive breakout with strong volume, the next potential target is the 205 level.
- Bearish Scenario: Conversely, a failure to breach this resistance could lead to a loss of momentum, potentially pulling the price back towards the 112 support level.
The price action in the coming week will be crucial in confirming the stock's next directional move.
Disclaimer: This analysis is my personal view & for educational purposes only. They shall not be construed as trade or investment advice. Before making any financial decision, it is imperative that you consult with a qualified financial professional.
Thông báo miễn trừ trách nhiệm
Thông tin và các ấn phẩm này không nhằm mục đích, và không cấu thành, lời khuyên hoặc khuyến nghị về tài chính, đầu tư, giao dịch hay các loại khác do TradingView cung cấp hoặc xác nhận. Đọc thêm tại Điều khoản Sử dụng.