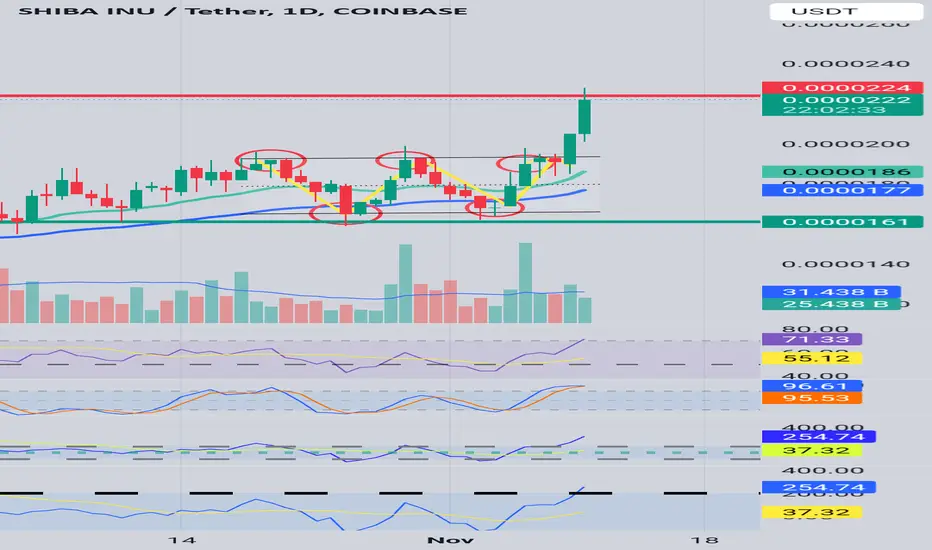
Is the double bottom formation complete even though the day chart candle did not print yet? there is a possibility of a slight pull back, a correction? hypothesizing because of the double bottom and the successful and blessed positive move after that.
Positives- weekly candle is above the 50 EMA
Day candle currently over 21 and 50 EMA
Weekly Chart has cup and handle forming
Negatives- SRSI and RSI and CCI on day chart both indicate asset is overbought. Very close to a key level possible resistance.
Positives- weekly candle is above the 50 EMA
Day candle currently over 21 and 50 EMA
Weekly Chart has cup and handle forming
Negatives- SRSI and RSI and CCI on day chart both indicate asset is overbought. Very close to a key level possible resistance.
Thông báo miễn trừ trách nhiệm
Thông tin và ấn phẩm không có nghĩa là và không cấu thành, tài chính, đầu tư, kinh doanh, hoặc các loại lời khuyên hoặc khuyến nghị khác được cung cấp hoặc xác nhận bởi TradingView. Đọc thêm trong Điều khoản sử dụng.
Thông báo miễn trừ trách nhiệm
Thông tin và ấn phẩm không có nghĩa là và không cấu thành, tài chính, đầu tư, kinh doanh, hoặc các loại lời khuyên hoặc khuyến nghị khác được cung cấp hoặc xác nhận bởi TradingView. Đọc thêm trong Điều khoản sử dụng.