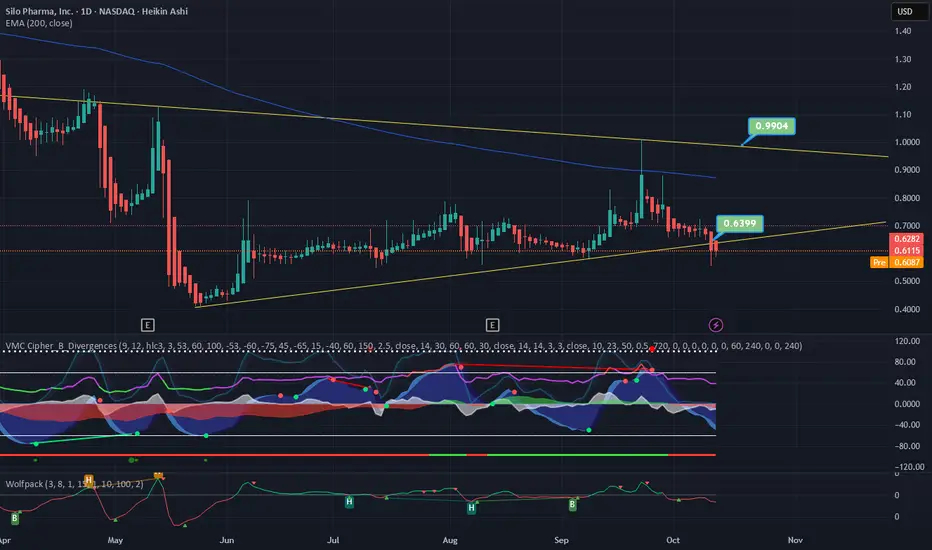
SILO is coiling inside a symmetrical triangle, building pressure for a potential breakout. The stock continues to respect its rising support trendline near $0.58–$0.60, showing solid accumulation.
The 200-day EMA (~$0.87) now acts as the key resistance to watch. A clean breakout and close above it could trigger momentum toward $0.99, the upper boundary of the triangle pattern.
Setup:
Entry: $0.60–$0.64
Targets: $0.87 / $0.99
Stop Loss: Below $0.57
Momentum indicators show early signs of strength. Holding the ascending trendline keeps the bullish bias intact — breakout confirmation above $0.87 could open the next leg up.
Thông báo miễn trừ trách nhiệm
Thông tin và ấn phẩm không có nghĩa là và không cấu thành, tài chính, đầu tư, kinh doanh, hoặc các loại lời khuyên hoặc khuyến nghị khác được cung cấp hoặc xác nhận bởi TradingView. Đọc thêm trong Điều khoản sử dụng.
Thông báo miễn trừ trách nhiệm
Thông tin và ấn phẩm không có nghĩa là và không cấu thành, tài chính, đầu tư, kinh doanh, hoặc các loại lời khuyên hoặc khuyến nghị khác được cung cấp hoặc xác nhận bởi TradingView. Đọc thêm trong Điều khoản sử dụng.