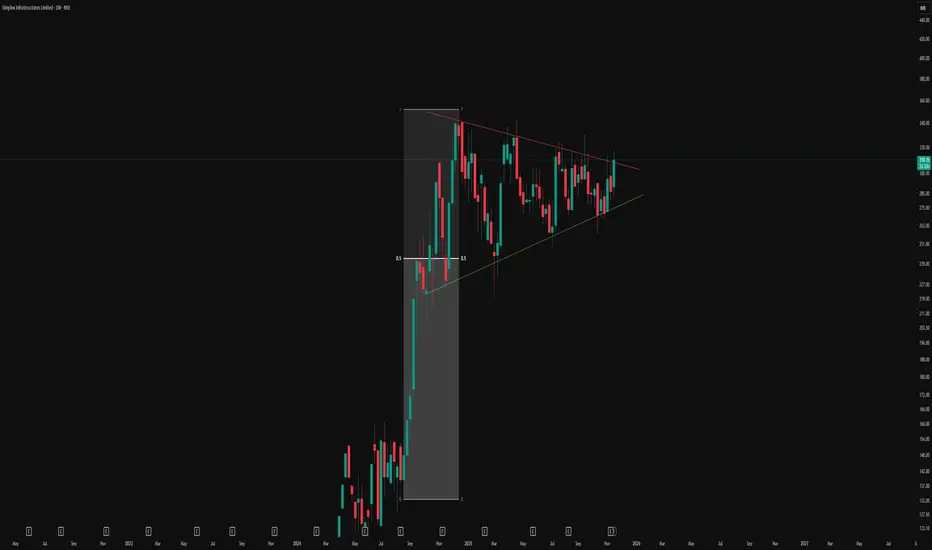
Visual Structure and Pattern
-This chart illustrates a textbook symmetrical triangle pattern forming after a strong directional move.
-The red line represents the counter trendline (CT), connecting a series of lower highs.
-The green line marks the ascending trendline, connecting the sequence of higher lows.
-These converging lines encapsulate a contracting price structure, where volatility reduces over time, emphasizing indecision and consolidation among market participants.
-Symmetrical triangles predominantly represent phases where markets consolidate after an impulsive run, and both sides (bulls and bears) gradually reach a point of agreement before the next expansion.
-The 50% equilibrium level within triangles often acts as a magnet for price, attracting liquidity and providing reference for institutional flows, a concept vital for advanced swing trading and risk management.
This post is strictly for educational and analytical purposes, focusing only on chart structures and observable patterns. No content here should be taken as an indication of future price direction or as investment advice.
🎯 Master My Self-Made Trading Strategy
📈 Telegram (Learn Today): t.me/hashtaghammer
✅ WhatsApp (Learn Today): wa.me/919455664601
📈 Telegram (Learn Today): t.me/hashtaghammer
✅ WhatsApp (Learn Today): wa.me/919455664601
Bài đăng liên quan
Thông báo miễn trừ trách nhiệm
Thông tin và các ấn phẩm này không nhằm mục đích, và không cấu thành, lời khuyên hoặc khuyến nghị về tài chính, đầu tư, giao dịch hay các loại khác do TradingView cung cấp hoặc xác nhận. Đọc thêm tại Điều khoản Sử dụng.