SLDB Fib. & Chart Update:
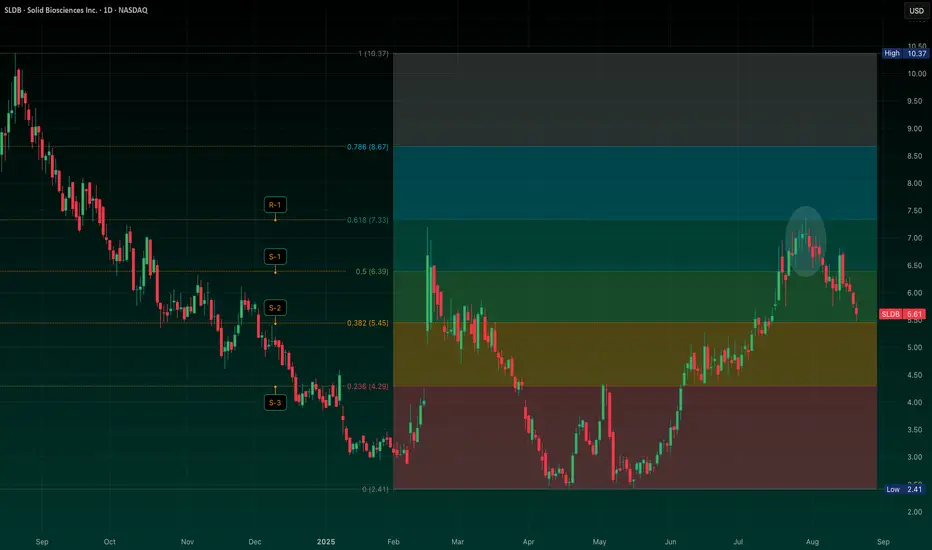
As flagged in my earlier post (Aug 4), weakness was expected absent fresh catalysts. The chart is now sitting around the 0.382 Fib retrace (~$5.45) -- a key support zone, IMO.
If this level doesn’t hold, the next downside marker lines up near the 0.236 (~$4.29). On the flip side, stabilization here would keep the prior breakout structure intact.
Nothing’s changed on the fundamental side since ER, so price action is doing the heavy lifting. And with the broader market showing signs of rolling over, sellers may press harder if this level cracks.
This is the spot where the tape either finds footing or breaks lower into the next leg. Stay tuned and GLTA.
Thông báo miễn trừ trách nhiệm
Thông tin và các ấn phẩm này không nhằm mục đích, và không cấu thành, lời khuyên hoặc khuyến nghị về tài chính, đầu tư, giao dịch hay các loại khác do TradingView cung cấp hoặc xác nhận. Đọc thêm tại Điều khoản Sử dụng.
Thông báo miễn trừ trách nhiệm
Thông tin và các ấn phẩm này không nhằm mục đích, và không cấu thành, lời khuyên hoặc khuyến nghị về tài chính, đầu tư, giao dịch hay các loại khác do TradingView cung cấp hoặc xác nhận. Đọc thêm tại Điều khoản Sử dụng.