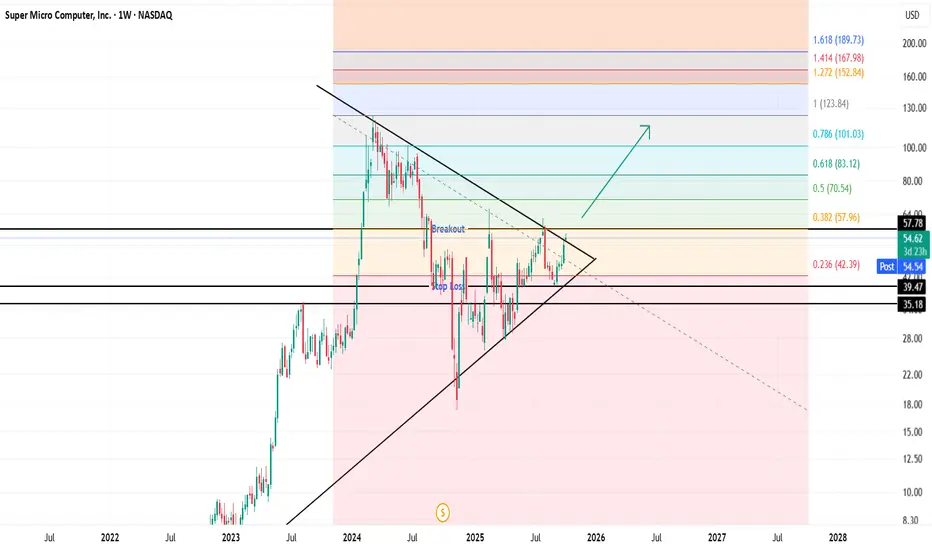
SMCI is at a major decision point. Wait for breakout confirmation above $57.78, use the triangle structure and Fibonacci extensions as your target zones, and manage risk via the marked stop levels. This technical setup combines classical charting with quantitative projections, providing a clear framework for swing traders and investors.
Key Levels and Setup
Symmetrical Triangle: Price is consolidating between converging trendlines, now nearing the apex, signaling an imminent breakout move.
Breakout Level: A sustained close above $57.78 (upper trendline/horizontal resistance) would confirm the bullish breakout.
Stop Loss: Clearly marked near the lower horizontal line (below $39.47 or $35.18) to protect against false breakouts.
Thông báo miễn trừ trách nhiệm
Thông tin và các ấn phẩm này không nhằm mục đích, và không cấu thành, lời khuyên hoặc khuyến nghị về tài chính, đầu tư, giao dịch hay các loại khác do TradingView cung cấp hoặc xác nhận. Đọc thêm tại Điều khoản Sử dụng.
Thông báo miễn trừ trách nhiệm
Thông tin và các ấn phẩm này không nhằm mục đích, và không cấu thành, lời khuyên hoặc khuyến nghị về tài chính, đầu tư, giao dịch hay các loại khác do TradingView cung cấp hoặc xác nhận. Đọc thêm tại Điều khoản Sử dụng.