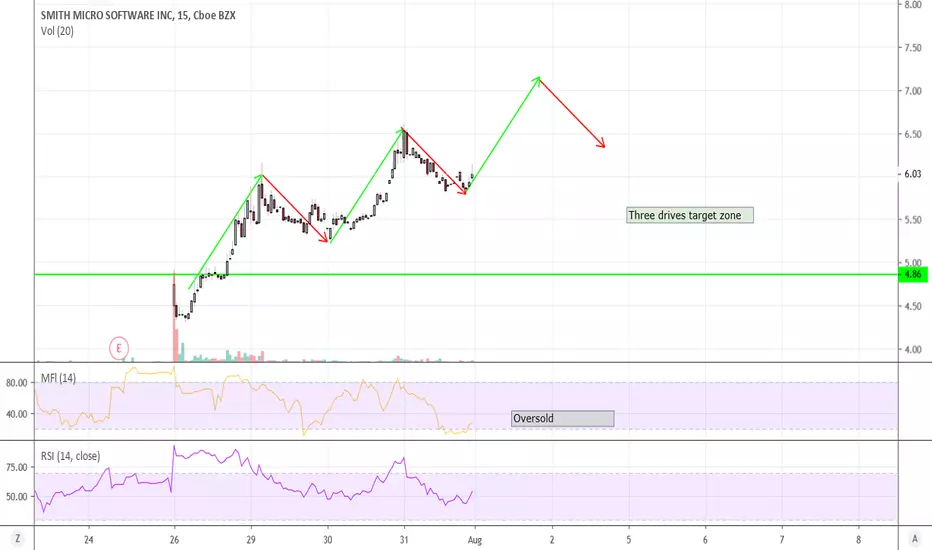
Not my favorite TA theory but it seems to fit the bill. I actually copied the green and red arrows so each one is identical in length and slope.
Of course there is always the possibility that this will just go full pumptard instead of pulling back. I am going to consider selling some if it follows the pattern. Will buy back if/when it drops.
Quit frankly I have 6k shares and I've been watching this thing go up and down $2 - 4k each day. Taking some profit might alleviate the heartburn.
BTW, oversold on 15 min chart, jumped up the last time it did that.
Thông báo miễn trừ trách nhiệm
Thông tin và các ấn phẩm này không nhằm mục đích, và không cấu thành, lời khuyên hoặc khuyến nghị về tài chính, đầu tư, giao dịch hay các loại khác do TradingView cung cấp hoặc xác nhận. Đọc thêm tại Điều khoản Sử dụng.
Thông báo miễn trừ trách nhiệm
Thông tin và các ấn phẩm này không nhằm mục đích, và không cấu thành, lời khuyên hoặc khuyến nghị về tài chính, đầu tư, giao dịch hay các loại khác do TradingView cung cấp hoặc xác nhận. Đọc thêm tại Điều khoản Sử dụng.