hi Traders
Let's have a look at SNAP stock.
It gets a lot of hate recently, but chart looks good for a bullish reversal.
📊 Chart Overview
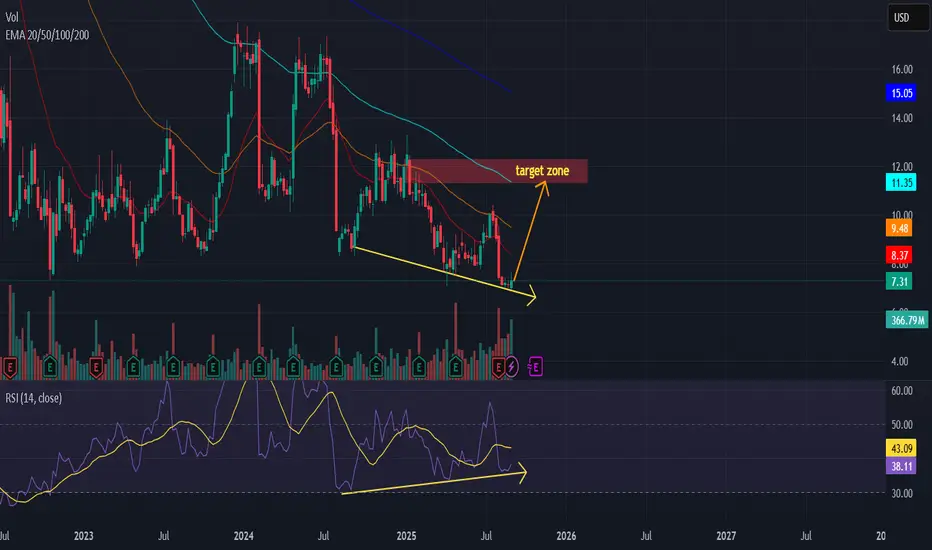
Current Price: $7.31
EMAs in play: 20 EMA ($8.37), 50 EMA ($9.48), 100 EMA ($11.35), 200 EMA ($15.05)
Volume: ~366.8M
🔎 Technical Analysis
Falling Wedge Structure
Price has been making lower lows but within a narrowing falling wedge pattern.
The wedge is approaching the support trendline, suggesting potential for a breakout.
Bullish Divergences (RSI)
RSI has formed higher lows, while price made lower lows.
This is a classic bullish divergence, hinting at weakening bearish momentum.
Volume Pickup
Recent green volume spikes suggest accumulation near the bottom support zone.
🎯 Target Zone
First target: $9.50 (50 EMA resistance).
Extended target: $11.35 – $12.00 (100 EMA + strong supply zone).
⚠️ Risk Management
Stop-loss: Below $6.80 (recent swing low, wedge support).
Risk/Reward Ratio: ~1:2.5 if aiming for $11–12 zone.
I personally won't sell below 11.
📈 Trading Idea
SNAP is showing signs of a potential bullish reversal on the 3-day timeframe. The combination of a falling wedge, bullish RSI divergence, and increasing volume supports a bounce toward higher resistance zones. A sustained break above the 20 & 50 EMAs could trigger momentum toward the $11–12 target zone.
Let's have a look at SNAP stock.
It gets a lot of hate recently, but chart looks good for a bullish reversal.
📊 Chart Overview
Current Price: $7.31
EMAs in play: 20 EMA ($8.37), 50 EMA ($9.48), 100 EMA ($11.35), 200 EMA ($15.05)
Volume: ~366.8M
🔎 Technical Analysis
Falling Wedge Structure
Price has been making lower lows but within a narrowing falling wedge pattern.
The wedge is approaching the support trendline, suggesting potential for a breakout.
Bullish Divergences (RSI)
RSI has formed higher lows, while price made lower lows.
This is a classic bullish divergence, hinting at weakening bearish momentum.
Volume Pickup
Recent green volume spikes suggest accumulation near the bottom support zone.
🎯 Target Zone
First target: $9.50 (50 EMA resistance).
Extended target: $11.35 – $12.00 (100 EMA + strong supply zone).
⚠️ Risk Management
Stop-loss: Below $6.80 (recent swing low, wedge support).
Risk/Reward Ratio: ~1:2.5 if aiming for $11–12 zone.
I personally won't sell below 11.
📈 Trading Idea
SNAP is showing signs of a potential bullish reversal on the 3-day timeframe. The combination of a falling wedge, bullish RSI divergence, and increasing volume supports a bounce toward higher resistance zones. A sustained break above the 20 & 50 EMAs could trigger momentum toward the $11–12 target zone.
💥 Free signals and ideas ➡ t.me/vfinvestment
Thông báo miễn trừ trách nhiệm
Thông tin và ấn phẩm không có nghĩa là và không cấu thành, tài chính, đầu tư, kinh doanh, hoặc các loại lời khuyên hoặc khuyến nghị khác được cung cấp hoặc xác nhận bởi TradingView. Đọc thêm trong Điều khoản sử dụng.
💥 Free signals and ideas ➡ t.me/vfinvestment
Thông báo miễn trừ trách nhiệm
Thông tin và ấn phẩm không có nghĩa là và không cấu thành, tài chính, đầu tư, kinh doanh, hoặc các loại lời khuyên hoặc khuyến nghị khác được cung cấp hoặc xác nhận bởi TradingView. Đọc thêm trong Điều khoản sử dụng.