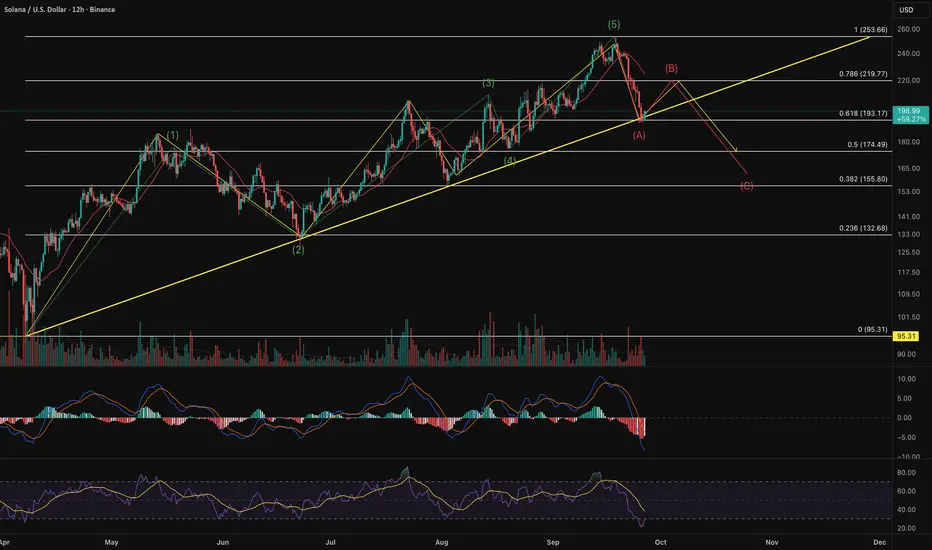
Wave B usually retraces 38‑62 % of wave A. A 38.2 % retracement from the wave‑A low (≈ US$193.17) yields a bounce to roughly US$216.28, while a 61.8 % retracement projects a rally toward US$230.55. The earlier peak around US$219.77 (78.6 % fib of the full range) provides a realistic target range (≈ US$216–231).
In zigzag corrections, wave C often equals wave A in length or extends by a Fibonacci multiple. Assuming wave B tops near US$219.77–230.55, a drop equal to the US$60.49 length of wave A would target US$159–170. The 38.2 % Fibonacci retracement of the entire move (≈ US$155.80) and the 50 % level (≈ US$174.49) mark likely support zones.
(generated by AI)
*All chart ideas references an opinion and is for information and entertainment purposes only. It is not intended to be investment advice.
*所有图表创意均参考观点,仅供参考和娱乐目的。 它不作为投资建议。
*所有图表创意均参考观点,仅供参考和娱乐目的。 它不作为投资建议。
Thông báo miễn trừ trách nhiệm
Thông tin và ấn phẩm không có nghĩa là và không cấu thành, tài chính, đầu tư, kinh doanh, hoặc các loại lời khuyên hoặc khuyến nghị khác được cung cấp hoặc xác nhận bởi TradingView. Đọc thêm trong Điều khoản sử dụng.