Technical structure and patterns
On the daily chart, SOL has formed an inverse head and shoulders pattern, a classic reversal pattern. A breakout above the neckline with increasing volume could lead to a move to $247.71. However, weak demand could jeopardize this scenario, triggering a fall even to $138.05.
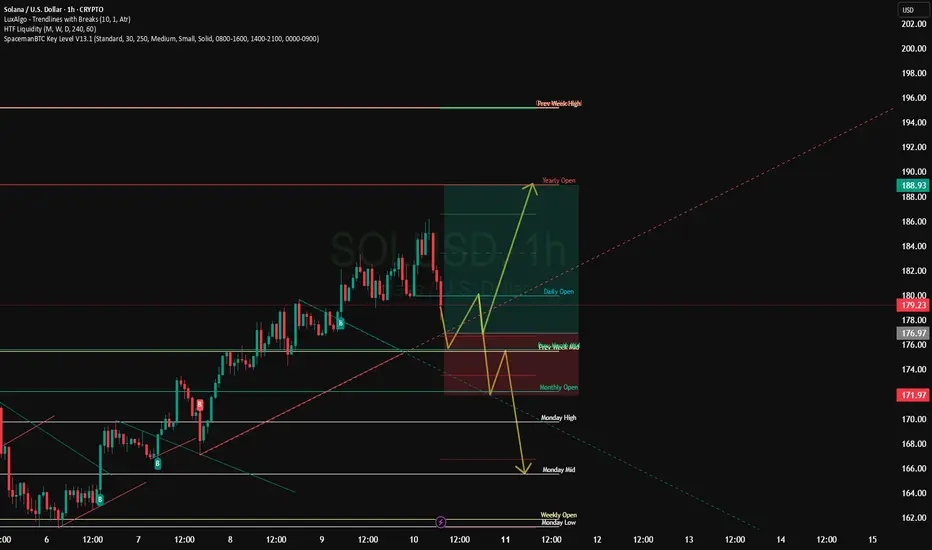
The asset has grown by 18% in a week, reaching $181, but there are liquidation clusters and strong resistance at $184–185. A breakout of this range could accelerate growth, with a possible surge to $256.
Support and resistance levels
Resistance:
The key zone is $180–184, a breakout of which would open the way to growth.
Support:
Important zones are $153–143, where cumulative activity was previously observed.
Network background and volume dynamics
The number of tokens on exchanges has decreased by almost 10%, which indicates a decrease in selling pressure. A "golden cross" is also forming between the 100- and 200-day EMAs - a bullish signal with target levels above $176.
Earlier, SOL rebounded from the support zone around $160 and is moving towards a breakout of $175. The further trajectory - growth or consolidation - will depend on how the price behaves at the border around $175.
On the daily chart, SOL has formed an inverse head and shoulders pattern, a classic reversal pattern. A breakout above the neckline with increasing volume could lead to a move to $247.71. However, weak demand could jeopardize this scenario, triggering a fall even to $138.05.
The asset has grown by 18% in a week, reaching $181, but there are liquidation clusters and strong resistance at $184–185. A breakout of this range could accelerate growth, with a possible surge to $256.
Support and resistance levels
Resistance:
The key zone is $180–184, a breakout of which would open the way to growth.
Support:
Important zones are $153–143, where cumulative activity was previously observed.
Network background and volume dynamics
The number of tokens on exchanges has decreased by almost 10%, which indicates a decrease in selling pressure. A "golden cross" is also forming between the 100- and 200-day EMAs - a bullish signal with target levels above $176.
Earlier, SOL rebounded from the support zone around $160 and is moving towards a breakout of $175. The further trajectory - growth or consolidation - will depend on how the price behaves at the border around $175.
Đóng lệnh: đạt mục tiêu
TP 1Ghi chú
Take Profit 2Bài đăng liên quan
Thông báo miễn trừ trách nhiệm
Thông tin và các ấn phẩm này không nhằm mục đích, và không cấu thành, lời khuyên hoặc khuyến nghị về tài chính, đầu tư, giao dịch hay các loại khác do TradingView cung cấp hoặc xác nhận. Đọc thêm tại Điều khoản Sử dụng.
Bài đăng liên quan
Thông báo miễn trừ trách nhiệm
Thông tin và các ấn phẩm này không nhằm mục đích, và không cấu thành, lời khuyên hoặc khuyến nghị về tài chính, đầu tư, giao dịch hay các loại khác do TradingView cung cấp hoặc xác nhận. Đọc thêm tại Điều khoản Sử dụng.