SOL/USD Technical Review
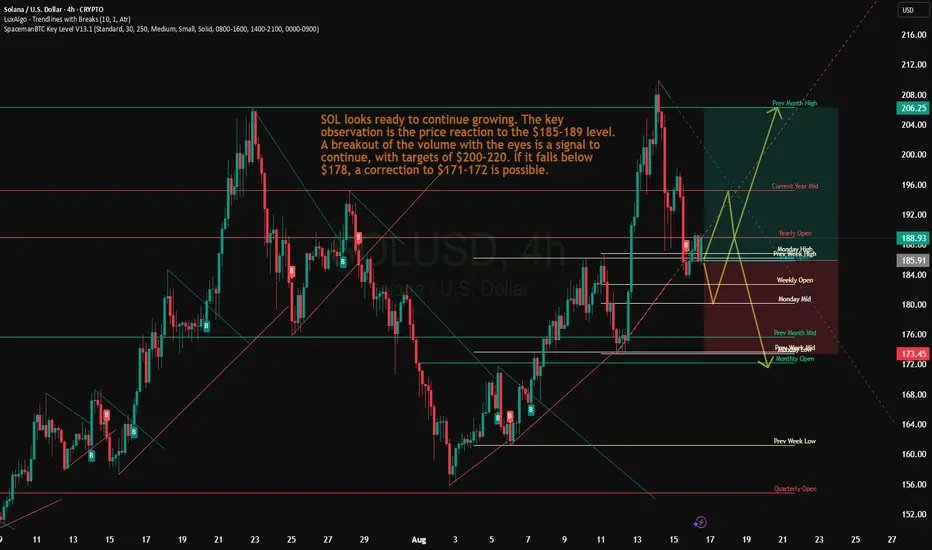
Support around $178 (20-day EMA) is holding the price, indicating high buying interest.
The key resistance level is $185–$189. A breakout of this range will open the way to targets of $200–206, possibly even $220 if the momentum continues.
Pattern formation: an upward reversal from the $160 zone (lower Bollinger band + Fibonacci) is recorded, which completes the ABC correction and launches a new wave impulse. Upside potential is towards $180.
Trend and on-chain indicators: a decrease in the balance on exchanges, an increase in TVL and growing institutional interest (ETF) create a solid base for moving higher.
Đóng lệnh: dừng lỗ
Take Profit 1 reachedGhi chú
TP 2Bài đăng liên quan
Thông báo miễn trừ trách nhiệm
Thông tin và ấn phẩm không có nghĩa là và không cấu thành, tài chính, đầu tư, kinh doanh, hoặc các loại lời khuyên hoặc khuyến nghị khác được cung cấp hoặc xác nhận bởi TradingView. Đọc thêm trong Điều khoản sử dụng.
Bài đăng liên quan
Thông báo miễn trừ trách nhiệm
Thông tin và ấn phẩm không có nghĩa là và không cấu thành, tài chính, đầu tư, kinh doanh, hoặc các loại lời khuyên hoặc khuyến nghị khác được cung cấp hoặc xác nhận bởi TradingView. Đọc thêm trong Điều khoản sử dụng.