1. Market Structure Overview
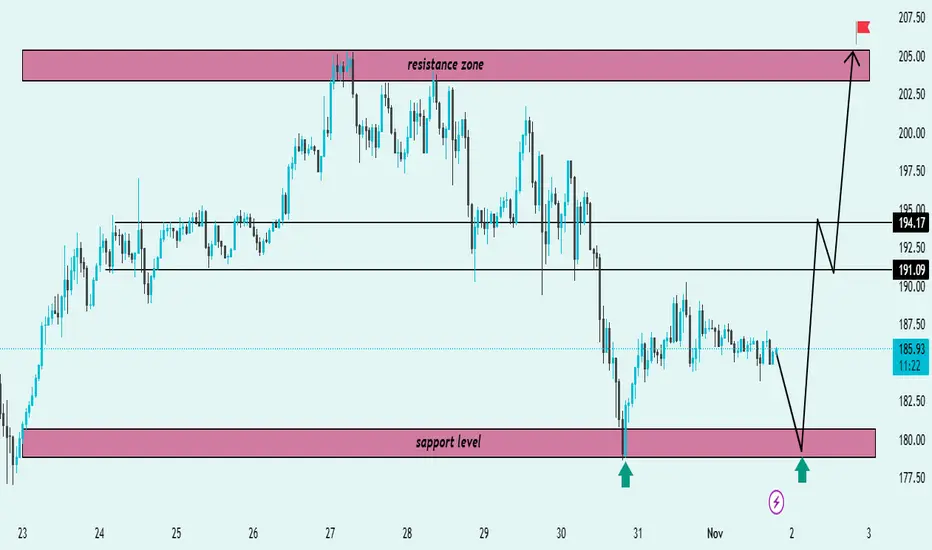
The chart shows Solana (SOL/USDT) trading within a well-defined range between a support level (~$179–$182) and a resistance zone (~$203–$207).
The price has recently tested the support zone multiple times (marked by green arrows), confirming its strength as a key demand area.
2. Key Technical Levels
Support Level: $179–$182 → Major demand zone where price has bounced twice.
Resistance Zone: $203–$207 → Supply area where previous rallies have reversed.
Mid-level Zones:
$191.09: Intermediate resistance (potential short-term reaction point).
$194.17: Secondary resistance before the upper target zone.
3. Price Action Insight
Price is currently consolidating around $185, showing indecision after a prior drop.
The black projection arrows suggest a potential liquidity sweep of the support zone before a bullish reversal.
Expected structure:
A final dip toward $180 to retest support.
A bullish reaction leading to a higher low formation.
A break above $191–$194, confirming bullish continuation.
A final push toward the resistance zone ($205) — the main target.
4. Trade Bias
Bias: Bullish from support
Confirmation Needed: Strong bullish candle or breakout from $191 resistance.
Invalidation: Daily close below $178 support.
5. Target Projection
Primary Target: $194
Final Target: $205 (resistance zone / flagged target)
Summary:
SOL/USDT is showing a potential bullish reversal setup from the $180 support zone. If price confirms strength with a bounce and breaks above $191–$194, the next rally could target the $205 resistance zone. A breakdown below $178 would invalidate the bullish scenario.
Giao dịch đang hoạt động
JOIN MY TELEGRAM CHANNEL LINK 👇🏻
t.me/Classicallegendschool
t.me/Classicallegendschool
Thông báo miễn trừ trách nhiệm
Thông tin và ấn phẩm không có nghĩa là và không cấu thành, tài chính, đầu tư, kinh doanh, hoặc các loại lời khuyên hoặc khuyến nghị khác được cung cấp hoặc xác nhận bởi TradingView. Đọc thêm trong Điều khoản sử dụng.