Indicators Used in the Setup
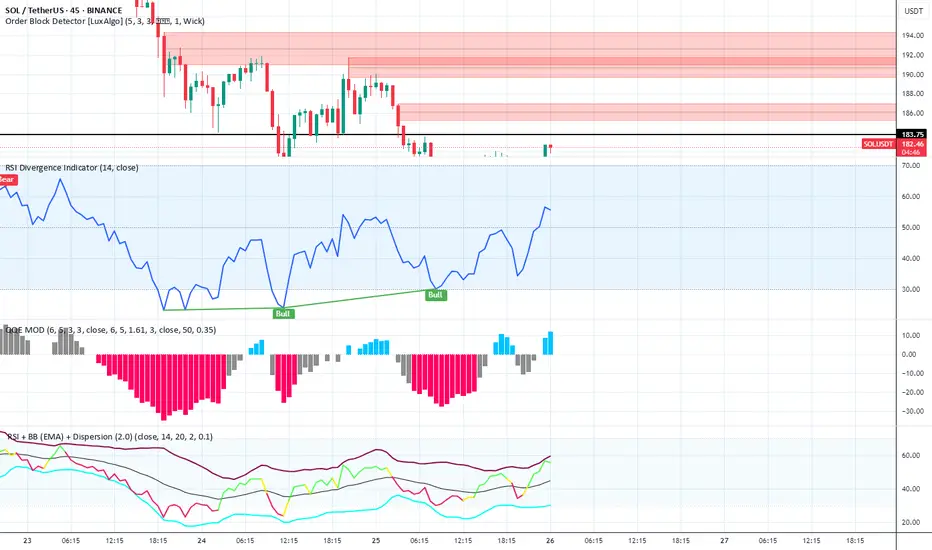
Order Block Detector [LuxAlgo]
Settings: (5, 3, 3), 1 Wick
Function: Highlights institutional order blocks to identify high-probability supply/demand zones.
Chart Insight: Multiple bearish order blocks marked in red between $186–$194, confirming strong overhead resistance. Price is reacting at the lower boundary (~$183.75), showing signs of rejection.
RSI Divergence Indicator (14)
Settings: 14-period RSI
Function: Detects bullish and bearish divergences between price and RSI.
Chart Insight: Bullish Divergence identified — price made a lower low while RSI made a higher low, signaling a potential trend reversal or bullish bounce.
QQE MOD
Settings: (6, 5, 3), Smoothing: 6.5, RSI Length: 14
Function: A momentum oscillator derived from RSI with smoothing and histogram representation.
Chart Insight:
Histogram flipped from red (bearish) to blue (bullish).
Bullish transition suggests increasing momentum in favor of bulls.
TSI – BB (EMA) + Dispersion
Function: Combines True Strength Index with Bollinger Band (EMA-based) and dispersion overlays.
Chart Insight:
TSI is rising toward midline with narrowing dispersion bands.
Indicates a potential volatility contraction before an expansion — likely upside if TSI crosses above signal.
Thông báo miễn trừ trách nhiệm
Thông tin và ấn phẩm không có nghĩa là và không cấu thành, tài chính, đầu tư, kinh doanh, hoặc các loại lời khuyên hoặc khuyến nghị khác được cung cấp hoặc xác nhận bởi TradingView. Đọc thêm trong Điều khoản sử dụng.
Thông báo miễn trừ trách nhiệm
Thông tin và ấn phẩm không có nghĩa là và không cấu thành, tài chính, đầu tư, kinh doanh, hoặc các loại lời khuyên hoặc khuyến nghị khác được cung cấp hoặc xác nhận bởi TradingView. Đọc thêm trong Điều khoản sử dụng.