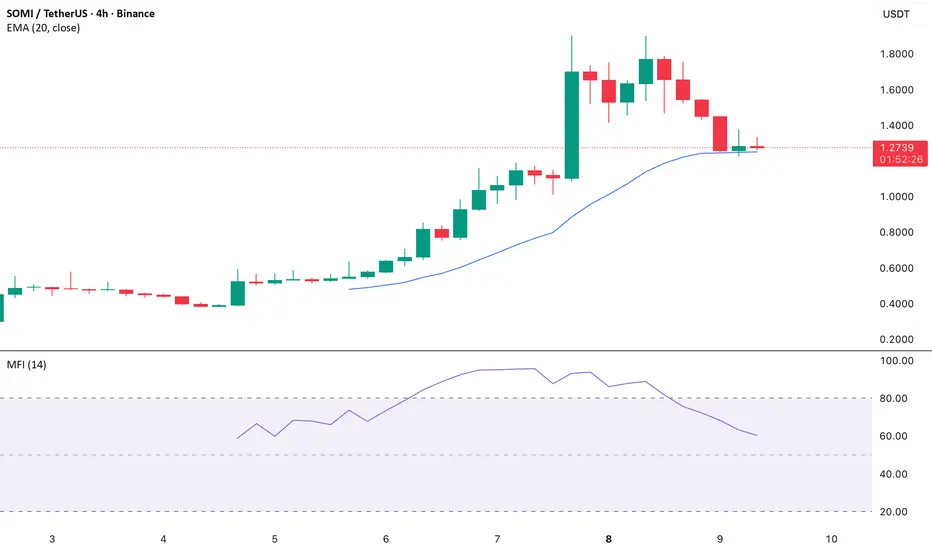
On the SOMI/USD four-hour chart, the Money Flow Index (MFI) has been trending downward, indicating a rise in selloffs. Since the MFI accounts for both price and volume, a decline confirms that sellers are steadily gaining control while buyers lose momentum.
SOMI’s recent price action has brought it closer to the 20-day Exponential Moving Average (EMA), underscoring fading buy-side strength. The EMA serves as a key gauge of short-term market sentiment—trading above it signals sustained bullishness, while a breakdown below suggests a bearish shift.
If SOMI closes decisively below the 20-day EMA, it would signal a move away from the token’s early post-launch optimism toward a more bearish phase. Such a breakdown could invite heavier selling pressure, paving the way for deeper losses ahead.
Leader in crypto news, award winning journalism in 26 languages.
Thông báo miễn trừ trách nhiệm
Thông tin và các ấn phẩm này không nhằm mục đích, và không cấu thành, lời khuyên hoặc khuyến nghị về tài chính, đầu tư, giao dịch hay các loại khác do TradingView cung cấp hoặc xác nhận. Đọc thêm tại Điều khoản Sử dụng.