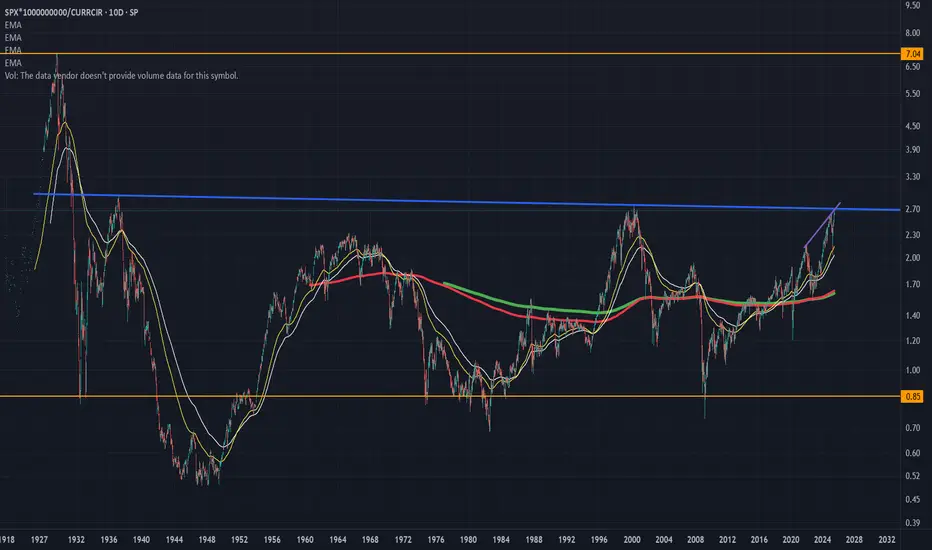
Here is a chart of the entire S and P history versus total currency in circulation.
This gives bubble periods (anytime the value is over 2) and times when the market crashed after being in a bubble.
If you notice we are fast approaching the line that broke the neck of the market in the 60s and 2000 dotcom bust.
If we clear that line, hold on to your hats because we are going into full blown speculative mania like just before the Great Depression!
In fact maybe the AI-crypto bubble will be exactly like the Great Depression, AI causing mass unemployment and global poverty.
Giao dịch đang hoạt động
I meant the 2 times that line snapped the neck of the bull was in 1936 and 2000 (not the 60s crash which was only a minor bubble).Thông báo miễn trừ trách nhiệm
Thông tin và ấn phẩm không có nghĩa là và không cấu thành, tài chính, đầu tư, kinh doanh, hoặc các loại lời khuyên hoặc khuyến nghị khác được cung cấp hoặc xác nhận bởi TradingView. Đọc thêm trong Điều khoản sử dụng.
Thông báo miễn trừ trách nhiệm
Thông tin và ấn phẩm không có nghĩa là và không cấu thành, tài chính, đầu tư, kinh doanh, hoặc các loại lời khuyên hoặc khuyến nghị khác được cung cấp hoặc xác nhận bởi TradingView. Đọc thêm trong Điều khoản sử dụng.