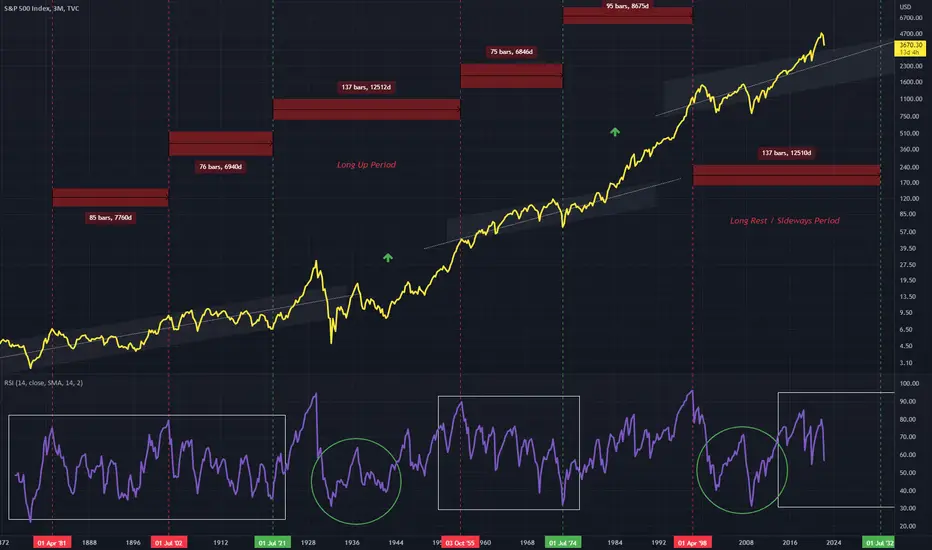
Two periods can be observed on the RSI for SPX on this 3Monthly chart
A downward trend which correlates with a sideways move on the relative timeframe
And a small uptrend that correlates with sharper growth on the SPX, these begin within the green circle
These green circles show very comparative structures, however one is during an up period, while the current one is during a sideways trend period
Price will very likely continue through the up channel on this larger timeframe
Thông báo miễn trừ trách nhiệm
Thông tin và ấn phẩm không có nghĩa là và không cấu thành, tài chính, đầu tư, kinh doanh, hoặc các loại lời khuyên hoặc khuyến nghị khác được cung cấp hoặc xác nhận bởi TradingView. Đọc thêm trong Điều khoản sử dụng.
Thông báo miễn trừ trách nhiệm
Thông tin và ấn phẩm không có nghĩa là và không cấu thành, tài chính, đầu tư, kinh doanh, hoặc các loại lời khuyên hoặc khuyến nghị khác được cung cấp hoặc xác nhận bởi TradingView. Đọc thêm trong Điều khoản sử dụng.