are always important later. click the "add more candles" blue arrow
Ghi chú
if it populates after publishing and provides oneGhi chú
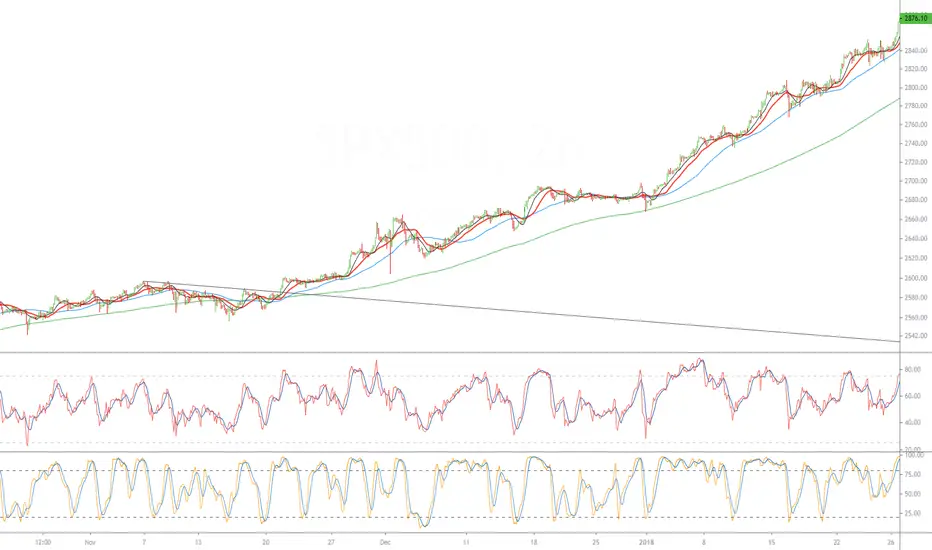
it didnt give me the blue arrow, but you can click and drag the chart to the left to show future candles and see the result. the point is to watch for these kinds of break outs (you can see how important that break out was by how far it went) and keep the line on your chart or be able to pick out the break out later and draw it in.Ghi chú
and if you think that is crazy, extend the same line to christmas 2018.Thông báo miễn trừ trách nhiệm
Thông tin và các ấn phẩm này không nhằm mục đích, và không cấu thành, lời khuyên hoặc khuyến nghị về tài chính, đầu tư, giao dịch hay các loại khác do TradingView cung cấp hoặc xác nhận. Đọc thêm tại Điều khoản Sử dụng.
Thông báo miễn trừ trách nhiệm
Thông tin và các ấn phẩm này không nhằm mục đích, và không cấu thành, lời khuyên hoặc khuyến nghị về tài chính, đầu tư, giao dịch hay các loại khác do TradingView cung cấp hoặc xác nhận. Đọc thêm tại Điều khoản Sử dụng.