Trump’s Decision Shakes Global Financial Markets
On Friday, 10 October, President Trump made an unexpected statement about the possible introduction of 100% tariffs on Chinese goods, triggering sharp price swings across global markets:
→ Stock markets: The S&P 500 index tumbled by more than 3%, hitting its lowest level in over a month.
→ Currency markets: The US dollar slumped sharply against other major currencies.
However, on Sunday, Donald Trump softened his tone on Truth Social, suggesting that trade relations with Beijing “will be absolutely fine”. Vice President JD Vance echoed this sentiment, adding that the United States is ready for talks if China is “prepared to act reasonably”.
This shift in rhetoric from US officials helped markets recover, with the S&P 500 index rebounding sharply at Monday’s open, reclaiming much of Friday’s losses.

Technical Analysis of the S&P 500 Chart
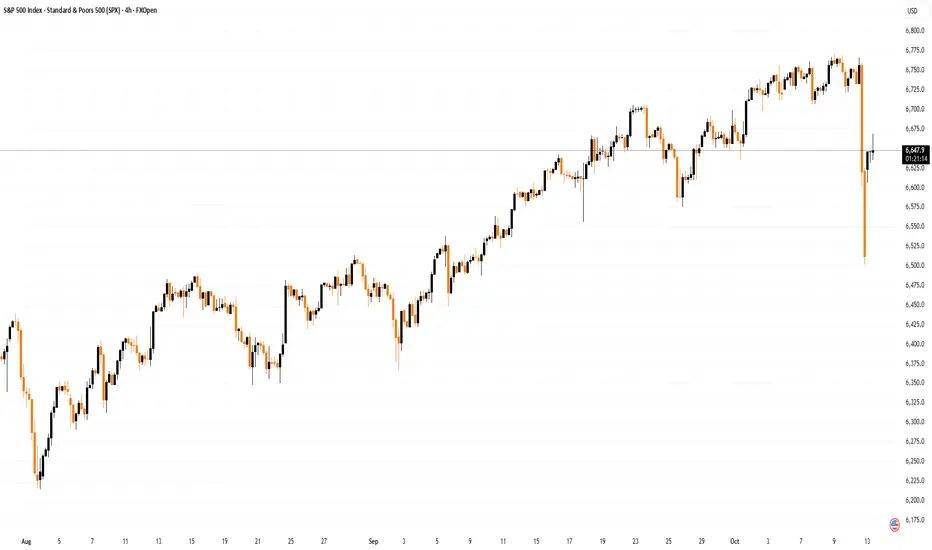
In our previous analysis of the 4-hour S&P 500 chart (US SPX 500 mini on FXOpen) on 4 October, we identified an upward channel (shown in blue) and expressed several concerns:
→ The price was approaching the upper boundary of the channel, where long positions are often closed for profit.
→ The latest peak slightly exceeded the October high (A), suggesting a potential bearish divergence.
→ The news blackout caused by the government shutdown created an “information vacuum”, which could quickly turn sentiment negative if filled with adverse developments.
The lower boundary of the blue channel offered only temporary support near 6,644 points on Friday before the price broke downwards. Doubling the channel width provides a projected target near 6,500, which coincides with Friday’s low.
Given these factors, it can be assumed that the lower line of the blue channel now acts as the median of a broader range following Friday’s sell-off. This suggests that in the coming days, the S&P 500 index may stabilise as demand and supply find temporary balance along this line.
Looking further ahead, the situation may resemble that of early April, when after a panic-driven market drop (also triggered by Trump’s tariff comments), the S&P 500 not only fully recovered but went on to reach new highs.
Key Levels:
→ 6,705 – a level that has acted as both support and resistance this autumn;
→ 6,606 – the boundary of the bullish gap.
This article represents the opinion of the Companies operating under the FXOpen brand only. It is not to be construed as an offer, solicitation, or recommendation with respect to products and services provided by the Companies operating under the FXOpen brand, nor is it to be considered financial advice.
On Friday, 10 October, President Trump made an unexpected statement about the possible introduction of 100% tariffs on Chinese goods, triggering sharp price swings across global markets:
→ Stock markets: The S&P 500 index tumbled by more than 3%, hitting its lowest level in over a month.
→ Currency markets: The US dollar slumped sharply against other major currencies.
However, on Sunday, Donald Trump softened his tone on Truth Social, suggesting that trade relations with Beijing “will be absolutely fine”. Vice President JD Vance echoed this sentiment, adding that the United States is ready for talks if China is “prepared to act reasonably”.
This shift in rhetoric from US officials helped markets recover, with the S&P 500 index rebounding sharply at Monday’s open, reclaiming much of Friday’s losses.
Technical Analysis of the S&P 500 Chart
In our previous analysis of the 4-hour S&P 500 chart (US SPX 500 mini on FXOpen) on 4 October, we identified an upward channel (shown in blue) and expressed several concerns:
→ The price was approaching the upper boundary of the channel, where long positions are often closed for profit.
→ The latest peak slightly exceeded the October high (A), suggesting a potential bearish divergence.
→ The news blackout caused by the government shutdown created an “information vacuum”, which could quickly turn sentiment negative if filled with adverse developments.
The lower boundary of the blue channel offered only temporary support near 6,644 points on Friday before the price broke downwards. Doubling the channel width provides a projected target near 6,500, which coincides with Friday’s low.
Given these factors, it can be assumed that the lower line of the blue channel now acts as the median of a broader range following Friday’s sell-off. This suggests that in the coming days, the S&P 500 index may stabilise as demand and supply find temporary balance along this line.
Looking further ahead, the situation may resemble that of early April, when after a panic-driven market drop (also triggered by Trump’s tariff comments), the S&P 500 not only fully recovered but went on to reach new highs.
Key Levels:
→ 6,705 – a level that has acted as both support and resistance this autumn;
→ 6,606 – the boundary of the bullish gap.
This article represents the opinion of the Companies operating under the FXOpen brand only. It is not to be construed as an offer, solicitation, or recommendation with respect to products and services provided by the Companies operating under the FXOpen brand, nor is it to be considered financial advice.
Thông báo miễn trừ trách nhiệm
Thông tin và ấn phẩm không có nghĩa là và không cấu thành, tài chính, đầu tư, kinh doanh, hoặc các loại lời khuyên hoặc khuyến nghị khác được cung cấp hoặc xác nhận bởi TradingView. Đọc thêm trong Điều khoản sử dụng.
Thông báo miễn trừ trách nhiệm
Thông tin và ấn phẩm không có nghĩa là và không cấu thành, tài chính, đầu tư, kinh doanh, hoặc các loại lời khuyên hoặc khuyến nghị khác được cung cấp hoặc xác nhận bởi TradingView. Đọc thêm trong Điều khoản sử dụng.