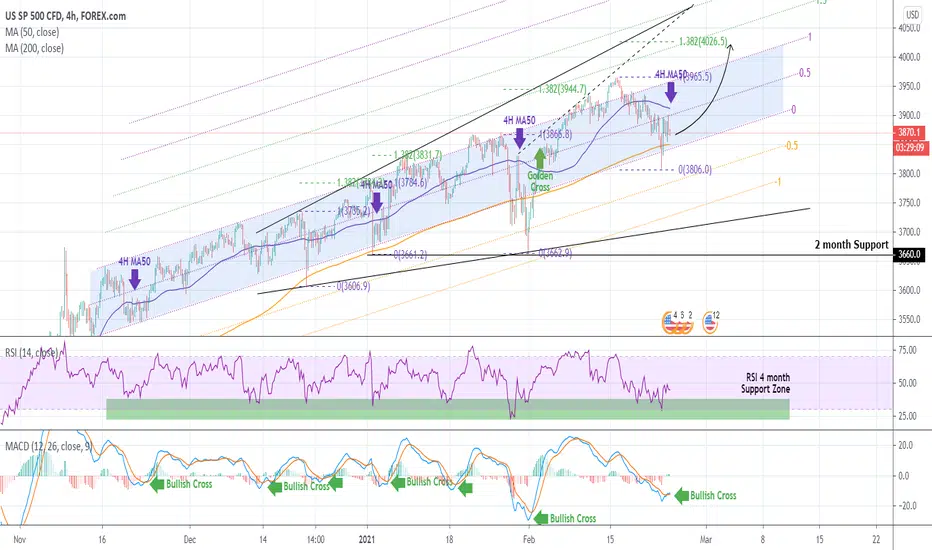
Pattern: Fibonacci Channel on 4H.
Signal: Buy as every time the MACD made a Bullish Cross, while the RSI had already hit its 4 month Support Zone, the index rose and made a new High. Last confirmation will be to close one session above the 4H MA50, which has previously been a mid-term Resistance within that Channel prior to a new High.
Target: 4000 (just below the 1.382 Fibonacci extension which has been an accurate metric of the next Higher High since December).
Most recent S&P500 signal:

Please like, subscribe and share your ideas and charts with the community!
--------------------------------------------------------------------------------------------------------
!! Donations via TradingView coins also help me a great deal at posting more free trading content and signals here !!
🎉 👍 Shout-out to TradingShot's 💰 top TradingView Coin donor 💰 this week ==> SocialCryptopreneur
--------------------------------------------------------------------------------------------------------
Signal: Buy as every time the MACD made a Bullish Cross, while the RSI had already hit its 4 month Support Zone, the index rose and made a new High. Last confirmation will be to close one session above the 4H MA50, which has previously been a mid-term Resistance within that Channel prior to a new High.
Target: 4000 (just below the 1.382 Fibonacci extension which has been an accurate metric of the next Higher High since December).
Most recent S&P500 signal:
Please like, subscribe and share your ideas and charts with the community!
--------------------------------------------------------------------------------------------------------
!! Donations via TradingView coins also help me a great deal at posting more free trading content and signals here !!
🎉 👍 Shout-out to TradingShot's 💰 top TradingView Coin donor 💰 this week ==> SocialCryptopreneur
--------------------------------------------------------------------------------------------------------
👑Best Signals (Forex/Crypto+70% accuracy) & Account Management (+20% profit/month on 10k accounts)
💰Free Channel t.me/tradingshotglobal
🤵Contact info@tradingshot.com t.me/tradingshot
🔥New service: next X100 crypto GEMS!
💰Free Channel t.me/tradingshotglobal
🤵Contact info@tradingshot.com t.me/tradingshot
🔥New service: next X100 crypto GEMS!
Thông báo miễn trừ trách nhiệm
Thông tin và ấn phẩm không có nghĩa là và không cấu thành, tài chính, đầu tư, kinh doanh, hoặc các loại lời khuyên hoặc khuyến nghị khác được cung cấp hoặc xác nhận bởi TradingView. Đọc thêm trong Điều khoản sử dụng.