Shriram Transport Finance (D) - Head & Shoulders Chart Pattern
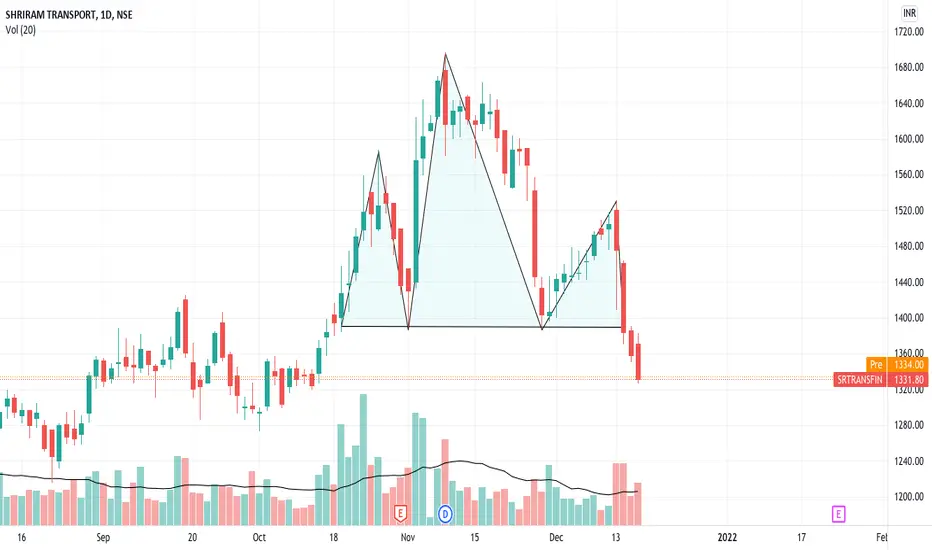
Shriram Transport Finance (Daily)
Head & Shoulders Chart Pattern
Lower bollinger band is challenged
MACD of the daily wave and weekly tide is downtick
RSI is below 40 in the oversold zone
Stochastic 14,3,3 is in negative crossover and oversold zone
-DI is above +DI and ADX is above 15 in the Directional Movement Index (DMI)
Seems to be in the C wave currently
Look for the next major support below on the chart as Target 1
Thông báo miễn trừ trách nhiệm
Thông tin và các ấn phẩm này không nhằm mục đích, và không cấu thành, lời khuyên hoặc khuyến nghị về tài chính, đầu tư, giao dịch hay các loại khác do TradingView cung cấp hoặc xác nhận. Đọc thêm tại Điều khoản Sử dụng.
Thông báo miễn trừ trách nhiệm
Thông tin và các ấn phẩm này không nhằm mục đích, và không cấu thành, lời khuyên hoặc khuyến nghị về tài chính, đầu tư, giao dịch hay các loại khác do TradingView cung cấp hoặc xác nhận. Đọc thêm tại Điều khoản Sử dụng.