This chart is saying loud and clear:
We may have just printed a bottom.
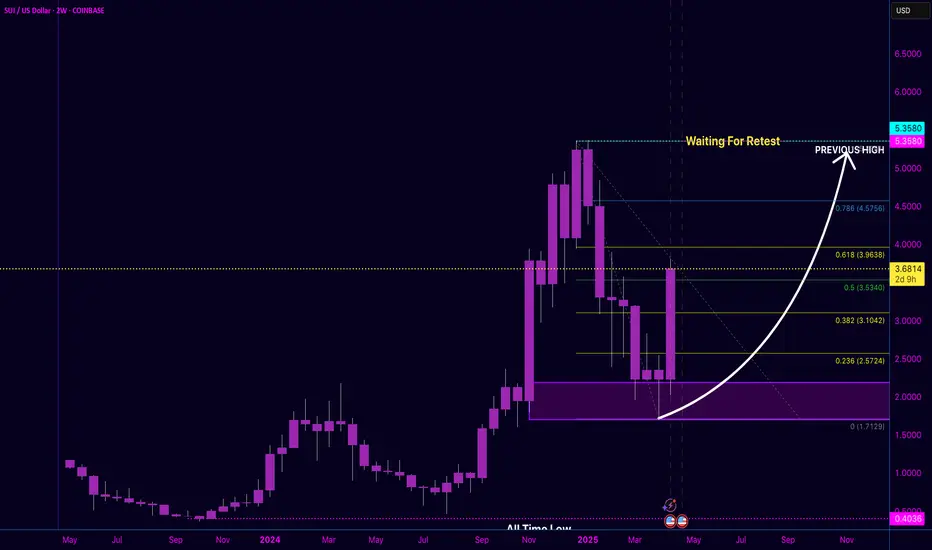
📈 After bouncing from the All-Time Low Zone, SUI surged with authority, reclaiming the .236 Fib and now eyeing .382 at $3.10+.
What I'm seeing:
✅ Bullish engulfing from demand
📊 Clear Fibonacci levels aligning with volume interest
🟣 Target area: $5.35 zone (Previous High) marked as "Waiting for Retest"
If this structure holds and momentum builds, we could see a Fibonacci wave toward the .618 at $3.96 and potentially a full retest into previous highs. But remember — confluence matters.
💡 This is why structure and candle maturity mean everything.
I’m not just reacting — I’m observing.
📍 Keep an eye on price behavior around the .382 level. That’s the next chess move.
#SUI #CryptoMarket #AltcoinSeason #ChartAnalysis #SmartMoneyFlow #FibonacciLevels #BreakoutWatch
We may have just printed a bottom.
📈 After bouncing from the All-Time Low Zone, SUI surged with authority, reclaiming the .236 Fib and now eyeing .382 at $3.10+.
What I'm seeing:
✅ Bullish engulfing from demand
📊 Clear Fibonacci levels aligning with volume interest
🟣 Target area: $5.35 zone (Previous High) marked as "Waiting for Retest"
If this structure holds and momentum builds, we could see a Fibonacci wave toward the .618 at $3.96 and potentially a full retest into previous highs. But remember — confluence matters.
💡 This is why structure and candle maturity mean everything.
I’m not just reacting — I’m observing.
📍 Keep an eye on price behavior around the .382 level. That’s the next chess move.
#SUI #CryptoMarket #AltcoinSeason #ChartAnalysis #SmartMoneyFlow #FibonacciLevels #BreakoutWatch
Thông báo miễn trừ trách nhiệm
Thông tin và các ấn phẩm này không nhằm mục đích, và không cấu thành, lời khuyên hoặc khuyến nghị về tài chính, đầu tư, giao dịch hay các loại khác do TradingView cung cấp hoặc xác nhận. Đọc thêm tại Điều khoản Sử dụng.
Thông báo miễn trừ trách nhiệm
Thông tin và các ấn phẩm này không nhằm mục đích, và không cấu thành, lời khuyên hoặc khuyến nghị về tài chính, đầu tư, giao dịch hay các loại khác do TradingView cung cấp hoặc xác nhận. Đọc thêm tại Điều khoản Sử dụng.