Alright, so  SUI is the most requested coin for me to cover, let's go starting with the WEEKLY view, the DAILY, 4-hour and the HOURLY charts in next posts later on this evening.
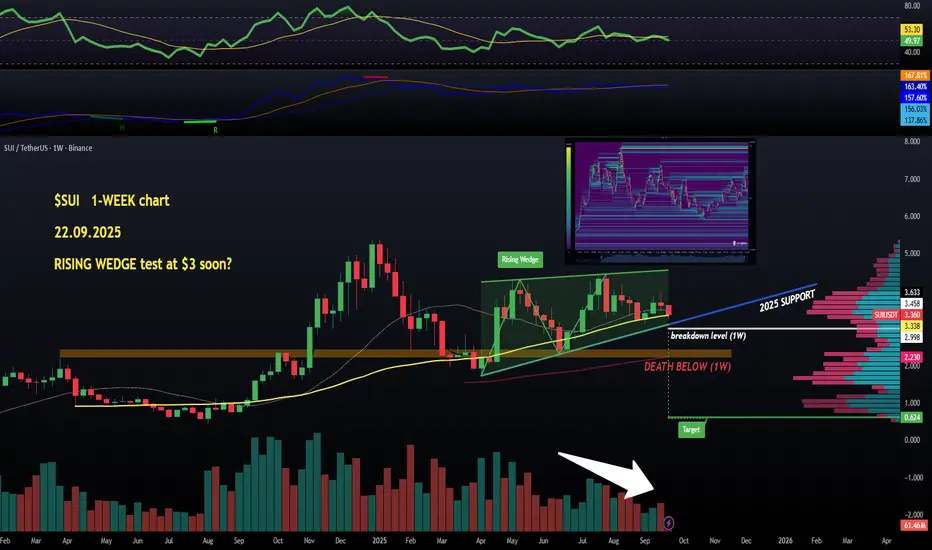
So the weekly has got one chart pattern to worry about, the 5-month-old RISING WEDGE which is basically a red flag despite making higher highs and higher low (bullish market structure intact).
#SUİ is still a touch above the yellow (50 MA) line, and key levels to watch are the $3 mark (breakdown level) and the blue rising support. We really don't want to lose any of these levels.
Actually, I will look for some shorts below $3.
Liquidity wise, not much to clear below the price, and a lot of it above the last local highs. See the attached Liquidity Map.
Next posts to continue the analysis on shorter timeframes☝️👽
Thông báo miễn trừ trách nhiệm
Thông tin và các ấn phẩm này không nhằm mục đích, và không cấu thành, lời khuyên hoặc khuyến nghị về tài chính, đầu tư, giao dịch hay các loại khác do TradingView cung cấp hoặc xác nhận. Đọc thêm tại Điều khoản Sử dụng.
Thông báo miễn trừ trách nhiệm
Thông tin và các ấn phẩm này không nhằm mục đích, và không cấu thành, lời khuyên hoặc khuyến nghị về tài chính, đầu tư, giao dịch hay các loại khác do TradingView cung cấp hoặc xác nhận. Đọc thêm tại Điều khoản Sử dụng.