Okay, so I did drop the  SUI weekly timeframes analysis yesterday (see the post I'm quoting), and this asset was showing a 5-month old bearish RISING WEDGE, so here I am zooming in on the DAILY chart for a more detailed view.
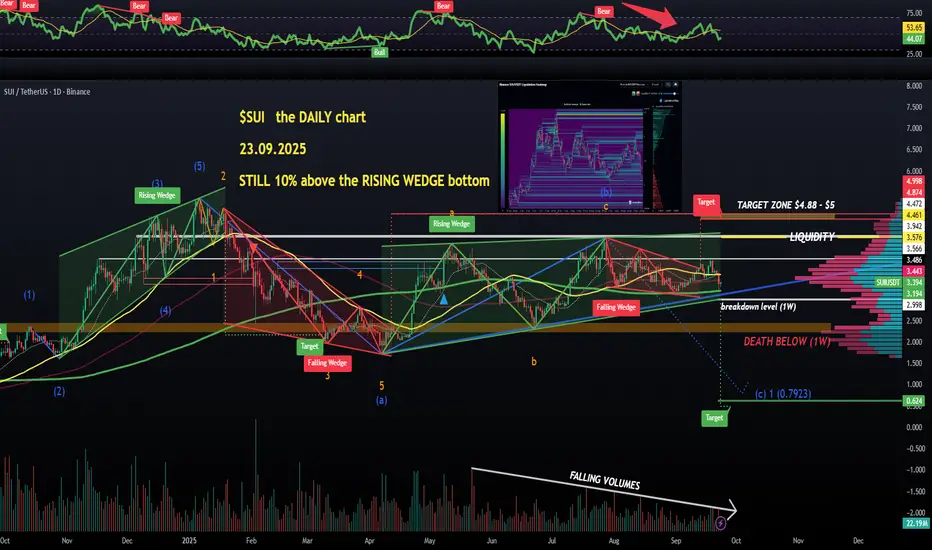
The wedge remains the main focus on the daily chart and a closer look is telling us that the lower trendline of this pattern is supported by the 200 MA (green line at $3.19 atm).
200 MA on 1D is widely considered as a BULL/BEAR market division line, so we really don't want to lose this RISING WEDGE/200 MA.
Now for any BULLISH moves, we first MUST see a breakout above $3.95. That will make the price action bullish on all smaller timeframes. Obviously nothing good will happend until BTC dominance starts showing weakness.
Based on the WEEKLY and DAILY alone, I'm not going to get involved with #SUI🔥 until it starts showing ACTUAL strenght.
For example, the volumes need to start picking up, the way they have been.. Falling volumes are never good for the BULLS👽💙
The wedge remains the main focus on the daily chart and a closer look is telling us that the lower trendline of this pattern is supported by the 200 MA (green line at $3.19 atm).
200 MA on 1D is widely considered as a BULL/BEAR market division line, so we really don't want to lose this RISING WEDGE/200 MA.
Now for any BULLISH moves, we first MUST see a breakout above $3.95. That will make the price action bullish on all smaller timeframes. Obviously nothing good will happend until
Based on the WEEKLY and DAILY alone, I'm not going to get involved with #SUI🔥 until it starts showing ACTUAL strenght.
For example, the volumes need to start picking up, the way they have been.. Falling volumes are never good for the BULLS👽💙
Thông báo miễn trừ trách nhiệm
The information and publications are not meant to be, and do not constitute, financial, investment, trading, or other types of advice or recommendations supplied or endorsed by TradingView. Read more in the Terms of Use.
Thông báo miễn trừ trách nhiệm
The information and publications are not meant to be, and do not constitute, financial, investment, trading, or other types of advice or recommendations supplied or endorsed by TradingView. Read more in the Terms of Use.