✅ Current Price & Context
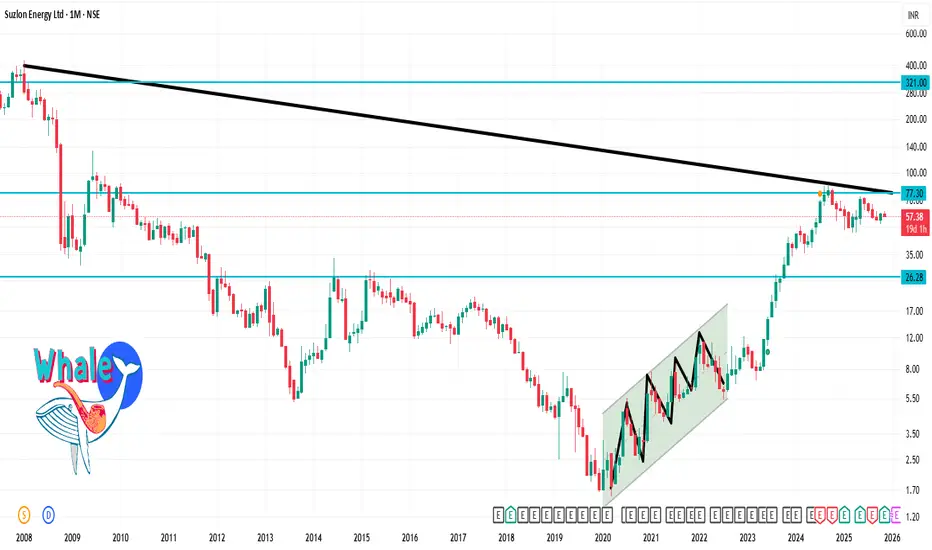
The stock is trading around ₹ 57.38 on the NSE.
Technical indicators give a mixed but mildly positive bias: Many moving averages show “Buy” signals aside from some longer-term averages.
On a charting site, for short term the support is about ₹ 52.67 and resistance about ₹ 60.40.
🔍 One-Month Timeframe Levels
Here are suggested levels to watch for the next ~4-5 weeks:
Support level: around ₹ 52-53
Resistance level: around ₹ 60-61 (or slightly above)
Intermediate pivot / near‐term area: around ₹ 56-58
Bài đăng liên quan
Thông báo miễn trừ trách nhiệm
Thông tin và các ấn phẩm này không nhằm mục đích, và không cấu thành, lời khuyên hoặc khuyến nghị về tài chính, đầu tư, giao dịch hay các loại khác do TradingView cung cấp hoặc xác nhận. Đọc thêm tại Điều khoản Sử dụng.
Bài đăng liên quan
Thông báo miễn trừ trách nhiệm
Thông tin và các ấn phẩm này không nhằm mục đích, và không cấu thành, lời khuyên hoặc khuyến nghị về tài chính, đầu tư, giao dịch hay các loại khác do TradingView cung cấp hoặc xác nhận. Đọc thêm tại Điều khoản Sử dụng.