🔍 Chart Analysis
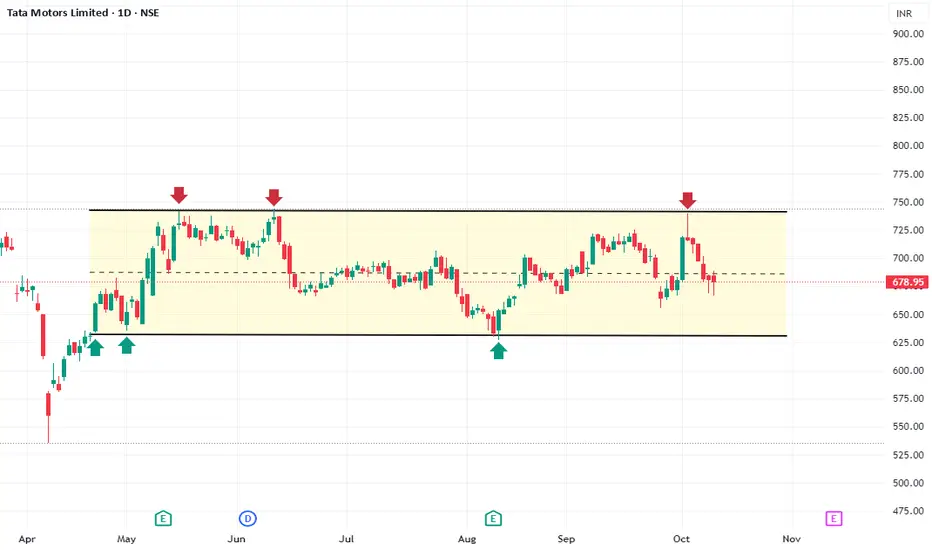
The chart for Tata Motors Ltd. (TATAMOTORS) on the Daily timeframe is showing a prolonged period of consolidation, forming a Rectangle Pattern. This pattern indicates that buyers and sellers are in a state of balance, trapping the price between two key horizontal levels.
Pattern: Rectangle / Horizontal Consolidation Range.
Timeframe: Daily.
Resistance (Supply Zone): The strong overhead resistance is approximately at the ₹740 - ₹750 zone. The price has been rejected from this level multiple times (indicated by the red arrows).
Support (Demand Zone): The solid base of support lies around the ₹630 - ₹640 zone. The price has bounced strongly from this level multiple times (indicated by the green arrows).
Current Position: The stock is currently trading near the midpoint of this range (around ₹678.95), which is a zone of indecision, making immediate trades riskier.
A significant price move, or a Market Structure Shift (MSS), will only be confirmed upon a decisive, high-volume breakout and close above the resistance or below the support.
📈 Trade Plan (Range Trading)
Given the current position within the range, the primary strategy is to trade the boundaries until a confirmed breakout occurs.
1. Bullish Scenario (Long Trade)
This is a counter-trend move within the range, trading off the support.
Entry: Look for a buy entry near the Support Zone of ₹630 - ₹640. Wait for clear bullish reversal signals (like a hammer, engulfing pattern, or double bottom on lower timeframes) at this level.
Stop Loss (SL): Place the stop loss a few points below the support zone, for example, around ₹620.
Target (T): Target the upper boundary/resistance zone at ₹740 - ₹750.
2. Bearish Scenario (Short Trade)
This is a counter-trend move within the range, trading off the resistance.
Entry: Look for a short entry near the Resistance Zone of ₹740 - ₹750. Wait for clear bearish reversal signals (like a shooting star, bearish engulfing pattern, or double top on lower timeframes) at this level.
Stop Loss (SL): Place the stop loss a few points above the resistance zone, for example, around ₹760.
Target (T): Target the lower boundary/support zone at ₹630 - ₹640.
🔑 Breakout Trade Plan (Trend Trade - MSS Confirmation)
The highest probability moves will be on a confirmed breakout from the rectangle, which would establish a new trend direction.
3. Confirmed MSS to the Upside (Trend Continuation)
Entry Condition: A decisive close and sustained trade (Daily close) ABOVE ₹750 on high volume. This will constitute the Market Structure Shift (MSS) to the upside.
Stop Loss (SL): Place the stop loss just inside the broken resistance zone (e.g., ₹730).
Target: The measured move target would be the height of the rectangle (₹750 - ₹630 = ₹120) projected upwards. Target = ₹870.
4. Confirmed MSS to the Downside (Trend Reversal/Continuation)
Entry Condition: A decisive close and sustained trade (Daily close) BELOW ₹630 on high volume. This will constitute the Market Structure Shift (MSS) to the downside.
Stop Loss (SL): Place the stop loss just inside the broken support zone (e.g., ₹650).
Target: The measured move target would be the height of the rectangle (₹120) projected downwards. Target = ₹510.
Thông báo miễn trừ trách nhiệm
Thông tin và các ấn phẩm này không nhằm mục đích, và không cấu thành, lời khuyên hoặc khuyến nghị về tài chính, đầu tư, giao dịch hay các loại khác do TradingView cung cấp hoặc xác nhận. Đọc thêm tại Điều khoản Sử dụng.
Thông báo miễn trừ trách nhiệm
Thông tin và các ấn phẩm này không nhằm mục đích, và không cấu thành, lời khuyên hoặc khuyến nghị về tài chính, đầu tư, giao dịch hay các loại khác do TradingView cung cấp hoặc xác nhận. Đọc thêm tại Điều khoản Sử dụng.