On the 1-hour chart, Tata Motors exhibits a neutral trend, indicating indecision in the short term. Key technical indicators are as follows:
Relative Strength Index (RSI): Approximately 50, suggesting balanced buying and selling pressures.
Moving Averages: The stock is trading near its short-term moving averages, with no clear bullish or bearish crossover.
Volume: Trading volume is consistent with recent averages, showing no significant spikes.
Given these indicators, the stock is consolidating within a range, awaiting a catalyst for a directional move.
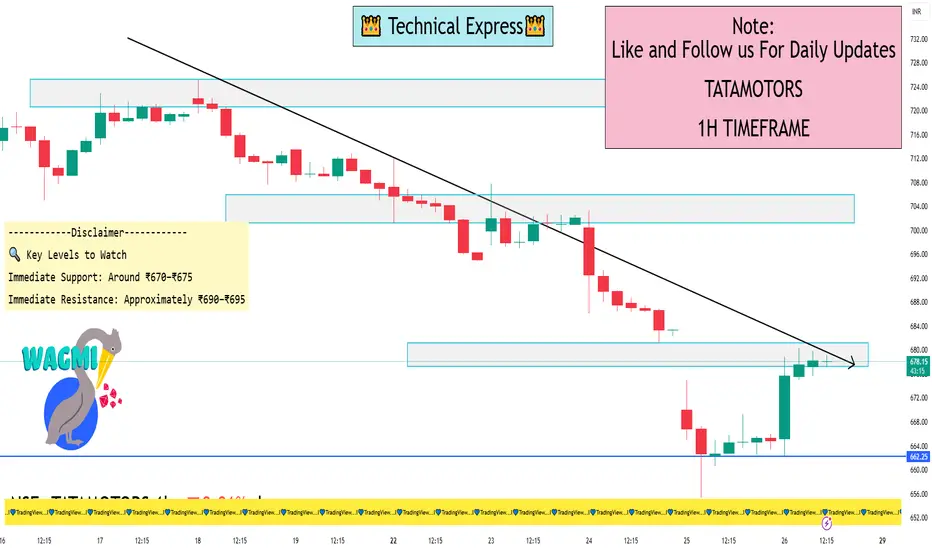
🔍 Key Levels to Watch
Immediate Support: Around ₹670–₹675. A breakdown below this level could lead to a retest of ₹650.
Immediate Resistance: Approximately ₹690–₹695. A breakout above this zone may target ₹720–₹730.
⚠️ Market Context
The recent uptick follows a challenging period marked by a cyberattack at Jaguar Land Rover, which had a significant financial impact. While operations are resuming, the stock remains sensitive to further developments.
Relative Strength Index (RSI): Approximately 50, suggesting balanced buying and selling pressures.
Moving Averages: The stock is trading near its short-term moving averages, with no clear bullish or bearish crossover.
Volume: Trading volume is consistent with recent averages, showing no significant spikes.
Given these indicators, the stock is consolidating within a range, awaiting a catalyst for a directional move.
🔍 Key Levels to Watch
Immediate Support: Around ₹670–₹675. A breakdown below this level could lead to a retest of ₹650.
Immediate Resistance: Approximately ₹690–₹695. A breakout above this zone may target ₹720–₹730.
⚠️ Market Context
The recent uptick follows a challenging period marked by a cyberattack at Jaguar Land Rover, which had a significant financial impact. While operations are resuming, the stock remains sensitive to further developments.
I built a Buy & Sell Signal Indicator with 85% accuracy.
📈 Get access via DM or
WhatsApp: wa.link/d997q0
Contact - +91 76782 40962
| Email: techncialexpress@gmail.com
| Script Coder | Trader | Investor | From India
📈 Get access via DM or
WhatsApp: wa.link/d997q0
Contact - +91 76782 40962
| Email: techncialexpress@gmail.com
| Script Coder | Trader | Investor | From India
Bài đăng liên quan
Thông báo miễn trừ trách nhiệm
Thông tin và các ấn phẩm này không nhằm mục đích, và không cấu thành, lời khuyên hoặc khuyến nghị về tài chính, đầu tư, giao dịch hay các loại khác do TradingView cung cấp hoặc xác nhận. Đọc thêm tại Điều khoản Sử dụng.