Hello Everyone,
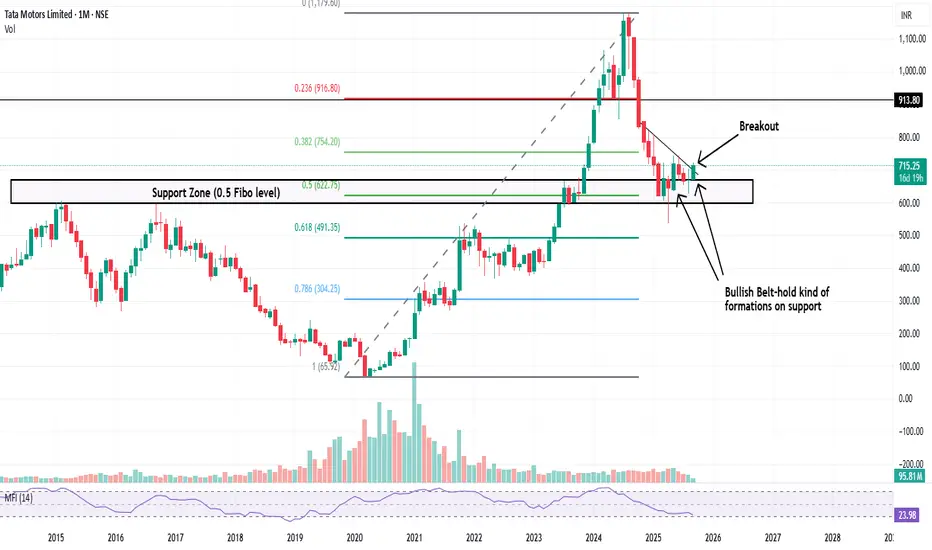
Here I have analysed the Tata Motors chart and it looks bullish for long term.
It has took Support on previous strong support.
And that zone is also 0.50 fibonacci level which is an healthly retracement considered in price action analysis.
Stock has also given breakout recently which looks good on 1W Timeframe.
So this stock looks good on 1M and 1W TF, hence this can be considered as bullish setup.
Disclaimer: This is just an a price action analysis of stock Tata Motors. Don't consider this as an stock tip or advice. Invest/Trade at your own risk.
Bài đăng liên quan
Thông báo miễn trừ trách nhiệm
Thông tin và ấn phẩm không có nghĩa là và không cấu thành, tài chính, đầu tư, kinh doanh, hoặc các loại lời khuyên hoặc khuyến nghị khác được cung cấp hoặc xác nhận bởi TradingView. Đọc thêm trong Điều khoản sử dụng.
Bài đăng liên quan
Thông báo miễn trừ trách nhiệm
Thông tin và ấn phẩm không có nghĩa là và không cấu thành, tài chính, đầu tư, kinh doanh, hoặc các loại lời khuyên hoặc khuyến nghị khác được cung cấp hoặc xác nhận bởi TradingView. Đọc thêm trong Điều khoản sử dụng.