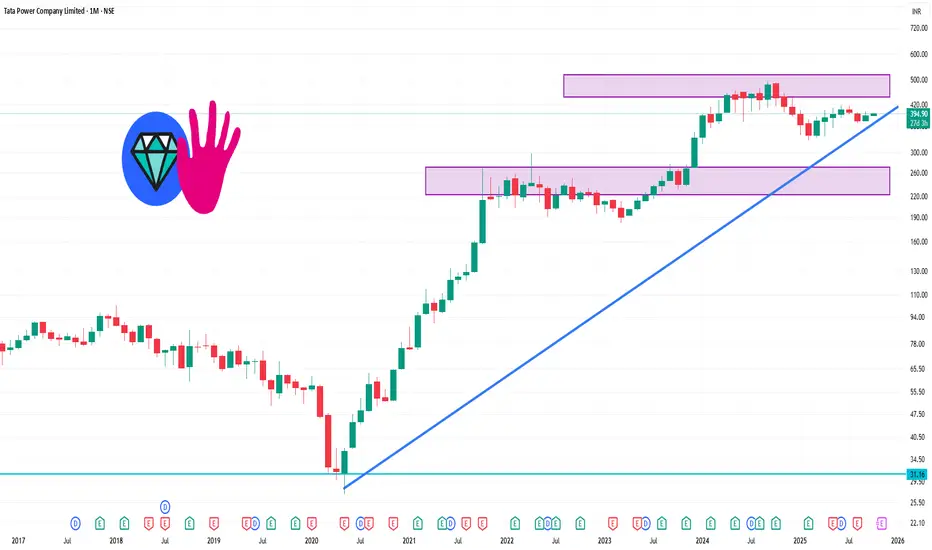
📊 1-Month Technical Overview
Over the past month, the stock has shown a modest upward movement of approximately 1.90%
TradingView
.
🔄 Pivot Points (Monthly)
Support Levels: ₹387.57, ₹375.23, ₹361.82
Resistance Levels: ₹413.32, ₹426.73, ₹440.14
The central pivot point stands at ₹400.98
📊 Technical Indicators
Relative Strength Index (RSI): 56.79 (Neutral)
Moving Average Convergence Divergence (MACD): 0.06 (Bullish)
Commodity Channel Index (CCI): -482.5 (Bullish)
Ultimate Oscillator: 80.16 (Bullish)
Simple Moving Averages (SMA): 20-day: ₹394.82, 50-day: ₹394.90, 200-day: ₹393.54 (All Bullish)
Exponential Moving Averages (EMA): 20-day: ₹394.92, 50-day: ₹394.79, 200-day: ₹393.68 (All Bullish)
🧠 Summary
Tata Power's stock is exhibiting a bullish trend over the past month, supported by positive technical indicators and sustained upward momentum. The current price is approaching key resistance levels, suggesting potential for further gains if these levels are breached. However, investors should remain cautious of broader market conditions and sector-specific challenges that could impact performance.
Bài đăng liên quan
Thông báo miễn trừ trách nhiệm
Thông tin và các ấn phẩm này không nhằm mục đích, và không cấu thành, lời khuyên hoặc khuyến nghị về tài chính, đầu tư, giao dịch hay các loại khác do TradingView cung cấp hoặc xác nhận. Đọc thêm tại Điều khoản Sử dụng.
Bài đăng liên quan
Thông báo miễn trừ trách nhiệm
Thông tin và các ấn phẩm này không nhằm mục đích, và không cấu thành, lời khuyên hoặc khuyến nghị về tài chính, đầu tư, giao dịch hay các loại khác do TradingView cung cấp hoặc xác nhận. Đọc thêm tại Điều khoản Sử dụng.