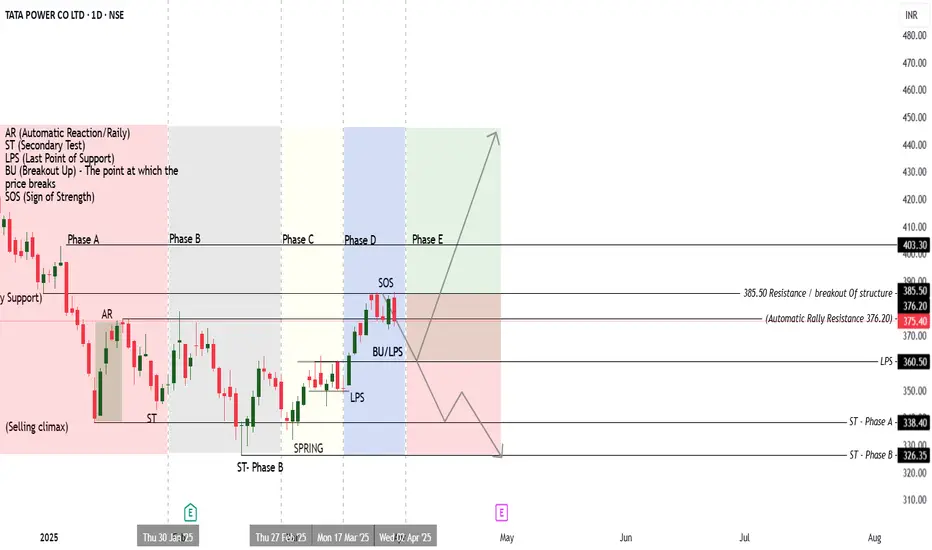
Wyckoff Method
Bullish Case:
Bearish Case:
Disclaimer: The above projections are based on technical analysis and the Wyckoff method. They are not guarantees of future price movement. The market is unpredictable, and all trading decisions should be made with caution and appropriate risk management.
- Phase A & B: Accumulation phase, price finds support, demand begins to emerge.
- Breakout: A breakout above resistance at 376.20 signals the start of an uptrend.
- Sign of Strength (SOS): Observed at 385, confirming bullish momentum.
- Bullish Target: Potential rise to 447 if the trend continues.
- Spring: Shakeout between 349-361, testing lower levels before moving upward.
- Bearish Target: Potential decline to 273 if the trend reverses.
Bullish Case:
- Resistance: Break above 376.20 and 385.50.
- Target: 403-410 range.
- Key Support: Must hold above 360-365.
Bearish Case:
- Support Test: Break below 360-365 could lead to further downside.
- Key Breakdown: A fall below 338.40 may signal a stronger bearish move.
- Target: Downside potential to 325-330 or even lower.
Disclaimer: The above projections are based on technical analysis and the Wyckoff method. They are not guarantees of future price movement. The market is unpredictable, and all trading decisions should be made with caution and appropriate risk management.
Thông báo miễn trừ trách nhiệm
Thông tin và ấn phẩm không có nghĩa là và không cấu thành, tài chính, đầu tư, kinh doanh, hoặc các loại lời khuyên hoặc khuyến nghị khác được cung cấp hoặc xác nhận bởi TradingView. Đọc thêm trong Điều khoản sử dụng.
Thông báo miễn trừ trách nhiệm
Thông tin và ấn phẩm không có nghĩa là và không cấu thành, tài chính, đầu tư, kinh doanh, hoặc các loại lời khuyên hoặc khuyến nghị khác được cung cấp hoặc xác nhận bởi TradingView. Đọc thêm trong Điều khoản sử dụng.