📊 1-Day Technical Analysis
📈 Support and Resistance Levels
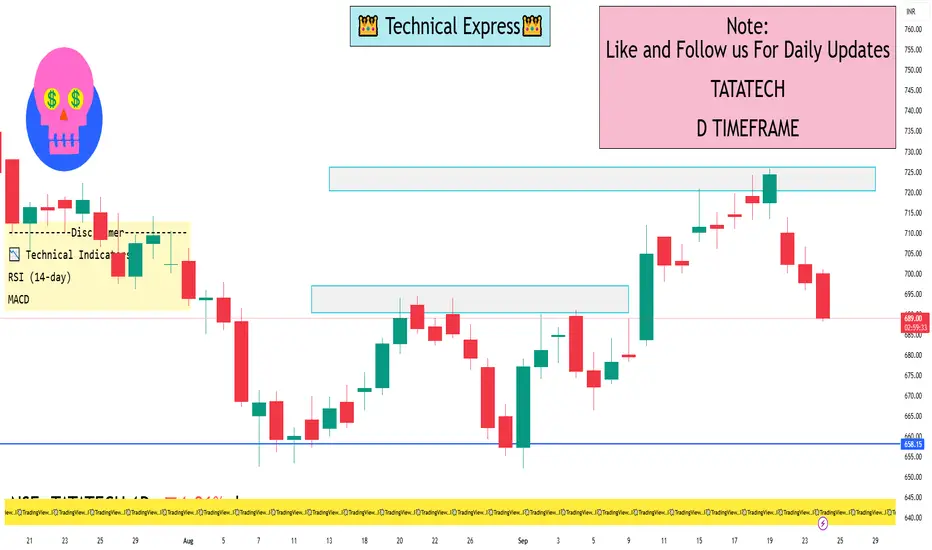
Immediate Support: ₹693.90
Immediate Resistance: ₹704.95
📉 Moving Averages
5-Day Moving Average: ₹696.90 (indicating a short-term bearish trend)
50-Day Moving Average: ₹710.72 (suggesting a bearish outlook)
200-Day Moving Average: ₹688.48 (indicating a long-term bullish trend)
📉 RSI (Relative Strength Index)
14-Day RSI: 33.53 (below 35, indicating an oversold condition and potential for a rebound)
📉 MACD (Moving Average Convergence Divergence)
MACD Value: -4.46 (below zero, confirming a bearish trend)
🔄 Overall Technical Indicators
Short-Term Outlook: Bearish
Medium-Term Outlook: Neutral
Long-Term Outlook: Bullish
🔮 Short-Term Forecast
The stock is expected to trade within a range of ₹690.89 to ₹704.61 on September 24, 2025, based on the 14-day Average True Range (ATR)
✅ Summary
Currently, Tata Technologies Ltd. exhibits a bearish short-term trend with potential for a rebound due to oversold conditions. Investors may consider monitoring for signs of stabilization or reversal before making trading decisions.
📈 Support and Resistance Levels
Immediate Support: ₹693.90
Immediate Resistance: ₹704.95
📉 Moving Averages
5-Day Moving Average: ₹696.90 (indicating a short-term bearish trend)
50-Day Moving Average: ₹710.72 (suggesting a bearish outlook)
200-Day Moving Average: ₹688.48 (indicating a long-term bullish trend)
📉 RSI (Relative Strength Index)
14-Day RSI: 33.53 (below 35, indicating an oversold condition and potential for a rebound)
📉 MACD (Moving Average Convergence Divergence)
MACD Value: -4.46 (below zero, confirming a bearish trend)
🔄 Overall Technical Indicators
Short-Term Outlook: Bearish
Medium-Term Outlook: Neutral
Long-Term Outlook: Bullish
🔮 Short-Term Forecast
The stock is expected to trade within a range of ₹690.89 to ₹704.61 on September 24, 2025, based on the 14-day Average True Range (ATR)
✅ Summary
Currently, Tata Technologies Ltd. exhibits a bearish short-term trend with potential for a rebound due to oversold conditions. Investors may consider monitoring for signs of stabilization or reversal before making trading decisions.
I built a Buy & Sell Signal Indicator with 85% accuracy.
📈 Get access via DM or
WhatsApp: wa.link/d997q0
Contact - +91 76782 40962
| Email: techncialexpress@gmail.com
| Script Coder | Trader | Investor | From India
📈 Get access via DM or
WhatsApp: wa.link/d997q0
Contact - +91 76782 40962
| Email: techncialexpress@gmail.com
| Script Coder | Trader | Investor | From India
Bài đăng liên quan
Thông báo miễn trừ trách nhiệm
Thông tin và các ấn phẩm này không nhằm mục đích, và không cấu thành, lời khuyên hoặc khuyến nghị về tài chính, đầu tư, giao dịch hay các loại khác do TradingView cung cấp hoặc xác nhận. Đọc thêm tại Điều khoản Sử dụng.