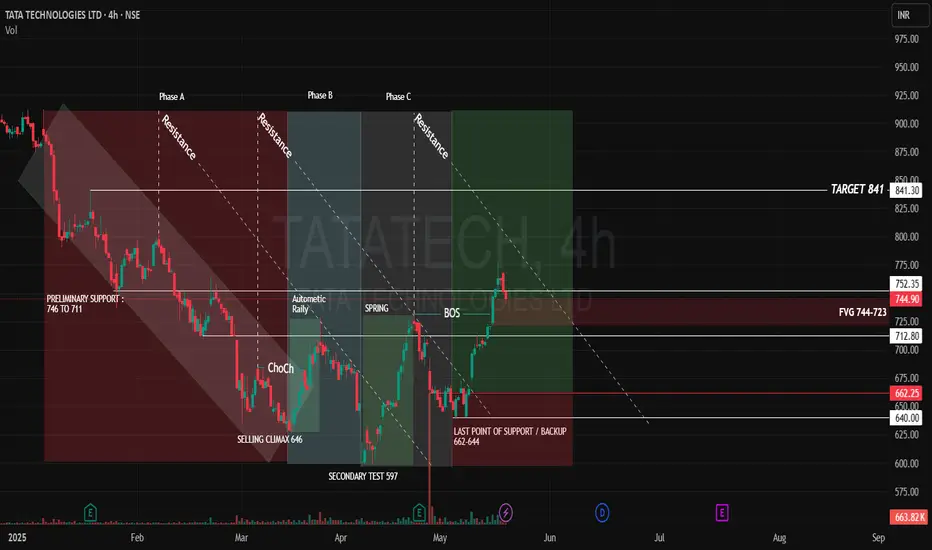
- Tata Technologies has shown a strong upward move from the Last Point of Support (LPS) near 640, in alignment with the Wyckoff Method. The price rallied up to 778, indicating strong bullish momentum.
- The trend structure reveals Higher Highs (HH) and Higher Lows (HL), confirming a bullish market structure. A Bullish Fair Value Gap (FVG) has been identified between 723 and 744, which could offer a second entry opportunity if price revisits and mitigates this zone.
- The downward resistance trendline, now plotted, may act as a key resistance zone. A breakout above this trendline would further confirm bullish strength.
- The Break of Structure (BOS) around 731 supports the projection of a continued move toward the target of 841. Additionally, the Preliminary Support zone (746–711)—previously a base for accumulation—may now act as a strong resistance-turned-support zone upon a successful breakout.
Trade Projection - Partial Entry: Around CMP (757)
- Final Entry Zone: If price revisits and mitigates the FVG at 723–744
- Target: 841
- Bullish Continuation: Look for future Bullish FVGs as signs of sustained momentum
Bearish Scenario – Selling Opportunity
If the FVG fails to hold and price breaks below 712, it would indicate a Change of Character (ChoCH) and invalidate the bullish setup. In that case, we could expect a decline toward the next support zone at 662.
Zones & Levels - FVG (Fair Value Gap): 744–723
- Target: 841.30
- Support Levels:
- 712.80
- 662.25
- 640.00
Disclaimer:lnkd.in/gJJDnvn2
Thông báo miễn trừ trách nhiệm
Thông tin và ấn phẩm không có nghĩa là và không cấu thành, tài chính, đầu tư, kinh doanh, hoặc các loại lời khuyên hoặc khuyến nghị khác được cung cấp hoặc xác nhận bởi TradingView. Đọc thêm trong Điều khoản sử dụng.
Thông báo miễn trừ trách nhiệm
Thông tin và ấn phẩm không có nghĩa là và không cấu thành, tài chính, đầu tư, kinh doanh, hoặc các loại lời khuyên hoặc khuyến nghị khác được cung cấp hoặc xác nhận bởi TradingView. Đọc thêm trong Điều khoản sử dụng.