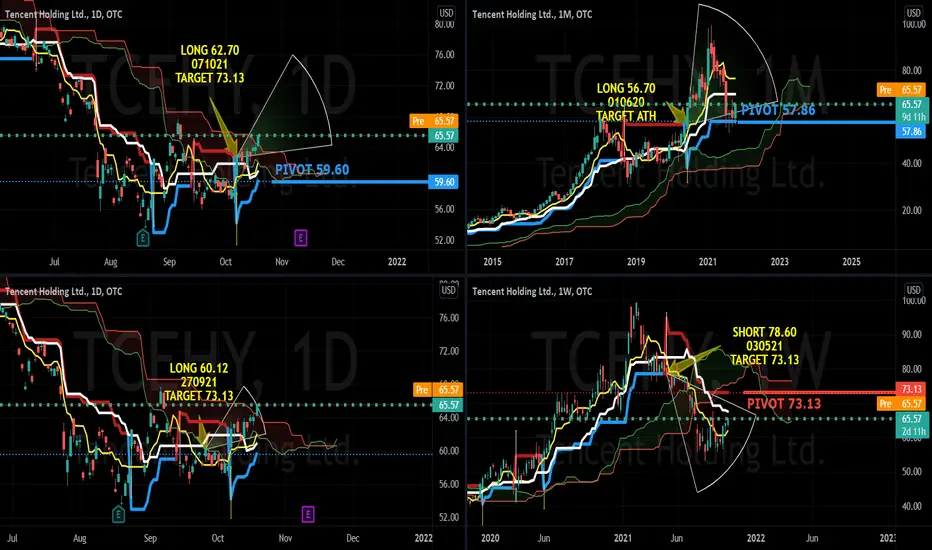
TCEHY has been on a medium term downtrend since 030521 since the short signal issued at $78.60. The long term charts is still long from 010620 at $56.70. A break above the weekly supertrend resistance at $73.13 may resume the uptrend supported by a long signal on the day charts at $62.70 on 071021
Long Term UPTREND since 010620
Medium Term DOWNTREND since 030521
Short Term BASEFORMING since 071021
PIVOT 73.13
Short positions below 73.13 for 59.60 and 41.26
Long positions above 73.13 for 99.40 and new ATH
Long Term UPTREND since 010620
Medium Term DOWNTREND since 030521
Short Term BASEFORMING since 071021
PIVOT 73.13
Short positions below 73.13 for 59.60 and 41.26
Long positions above 73.13 for 99.40 and new ATH
Quant Strategic Singapore
Thông báo miễn trừ trách nhiệm
Thông tin và các ấn phẩm này không nhằm mục đích, và không cấu thành, lời khuyên hoặc khuyến nghị về tài chính, đầu tư, giao dịch hay các loại khác do TradingView cung cấp hoặc xác nhận. Đọc thêm tại Điều khoản Sử dụng.
Quant Strategic Singapore
Thông báo miễn trừ trách nhiệm
Thông tin và các ấn phẩm này không nhằm mục đích, và không cấu thành, lời khuyên hoặc khuyến nghị về tài chính, đầu tư, giao dịch hay các loại khác do TradingView cung cấp hoặc xác nhận. Đọc thêm tại Điều khoản Sử dụng.