📌 Recent Price & Context
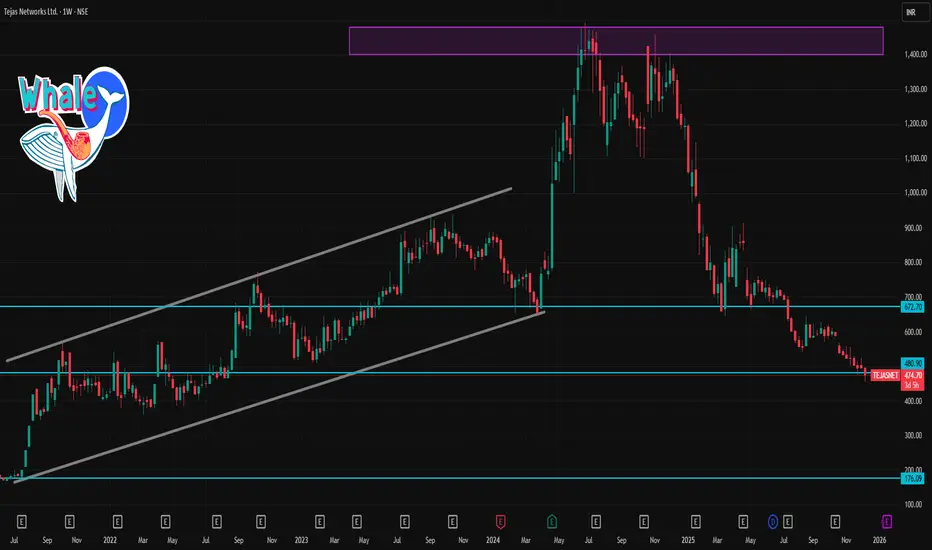
According to a live quote on 9 Dec 2025, Tejas Networks is trading around ₹471–₹476.
Recent technical‑indicator feeds (on daily chart) show oversold conditions: e.g. RSI ~ 20 (oversold), MACD negative, ADX high — indicating downward momentum + volatility.
On weekly‑timeframe classification, some aggregator sources rate the trend as “strong sell.”
So at this moment, the bias is bearish to neutral, unless a reversal catalyst emerges.
🎯 Weekly Pivot / Key Levels (Support & Resistance)
Using the most recent weekly pivot analysis:
Level Price (Approx)
Weekly Pivot (central) ₹503.7
Support Zone 1 (S1) ~ ₹482.5
Support Zone 2 (S2) ~ ₹470.9
Resistance 1 (R1) ~ ₹515.3
Resistance 2 (R2) ~ ₹536.5
Resistance 3 (R3) ~ ₹548.0–₹550+
Interpretation
The pivot at ₹503.7 marks the “line of neutrality.” Weekly closes above this level would shift bias more bullish.
As of now, with price ~ ₹472–₹476, the stock is well below weekly pivot → bearish / consolidation regime.
Downside buffer / support lies around ₹470–₹482; a breakdown below that could open further downside risk (unless long‑term support zones hold).
Upside resistance cluster lies at ₹515 → ₹536 → ₹548. To regain bullish momentum, price needs to first clear ₹503–₹515 zone, then aim higher.
Bài đăng liên quan
Thông báo miễn trừ trách nhiệm
Thông tin và các ấn phẩm này không nhằm mục đích, và không cấu thành, lời khuyên hoặc khuyến nghị về tài chính, đầu tư, giao dịch hay các loại khác do TradingView cung cấp hoặc xác nhận. Đọc thêm tại Điều khoản Sử dụng.
Bài đăng liên quan
Thông báo miễn trừ trách nhiệm
Thông tin và các ấn phẩm này không nhằm mục đích, và không cấu thành, lời khuyên hoặc khuyến nghị về tài chính, đầu tư, giao dịch hay các loại khác do TradingView cung cấp hoặc xác nhận. Đọc thêm tại Điều khoản Sử dụng.