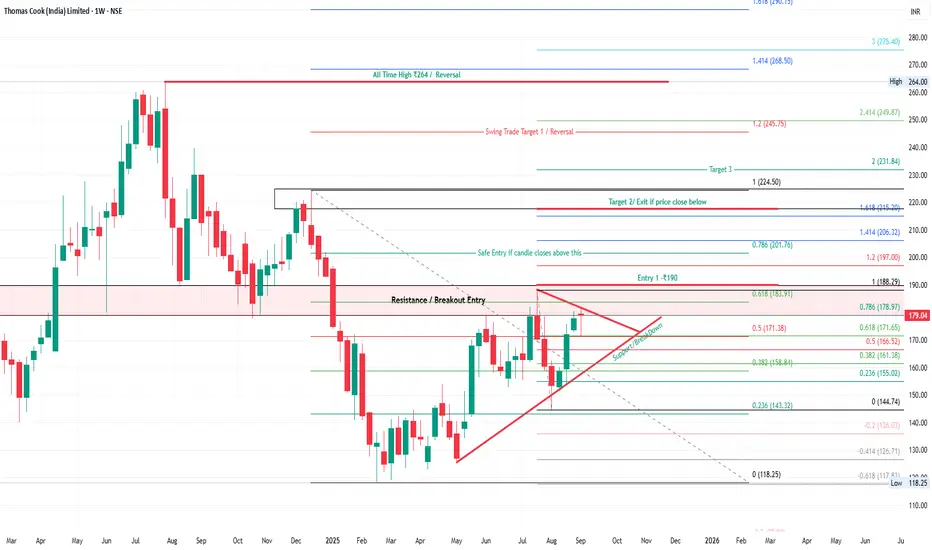
Thomas Cook is forming a triangle breakout structure on the weekly chart. Price is consolidating near resistance around ₹183–₹188. A weekly close above ₹190 will confirm breakout strength. Safe entry is above ₹190, with positional upside targets aligning with Fibonacci extensions.
📌 Key Technical Highlights:
Pattern: Symmetrical Triangle Breakout
Entry Zone: ₹183–₹190
Safe Entry: Above ₹190 on weekly close
Resistance Zone: ₹188–₹197
Support: ₹171, ₹158, ₹143
🎯 Upside Target Levels:
Target 1: ₹197
Target 2: ₹215
Target 3: ₹224
Target 4: ₹231
Swing Targets: ₹245 – ₹249
All-Time High: ₹264 (major reversal level)
⚠️ Downside Risk Levels:
₹171
₹158
₹143
₹118 (strong base support)
📈 Strategy Outlook:
Positional traders should wait for a strong weekly breakout above ₹190 for confirmation. Sustaining above this level can trigger momentum toward ₹224–₹245. A close below ₹171 weakens the setup.
Disclaimer:
This analysis is for educational purposes only and not financial advice. Do your own research before trading or investing.
Thông báo miễn trừ trách nhiệm
Thông tin và ấn phẩm không có nghĩa là và không cấu thành, tài chính, đầu tư, kinh doanh, hoặc các loại lời khuyên hoặc khuyến nghị khác được cung cấp hoặc xác nhận bởi TradingView. Đọc thêm trong Điều khoản sử dụng.
Thông báo miễn trừ trách nhiệm
Thông tin và ấn phẩm không có nghĩa là và không cấu thành, tài chính, đầu tư, kinh doanh, hoặc các loại lời khuyên hoặc khuyến nghị khác được cung cấp hoặc xác nhận bởi TradingView. Đọc thêm trong Điều khoản sử dụng.