Titan Chart Explanation as per Elliott Wave
Your updated chart combines:
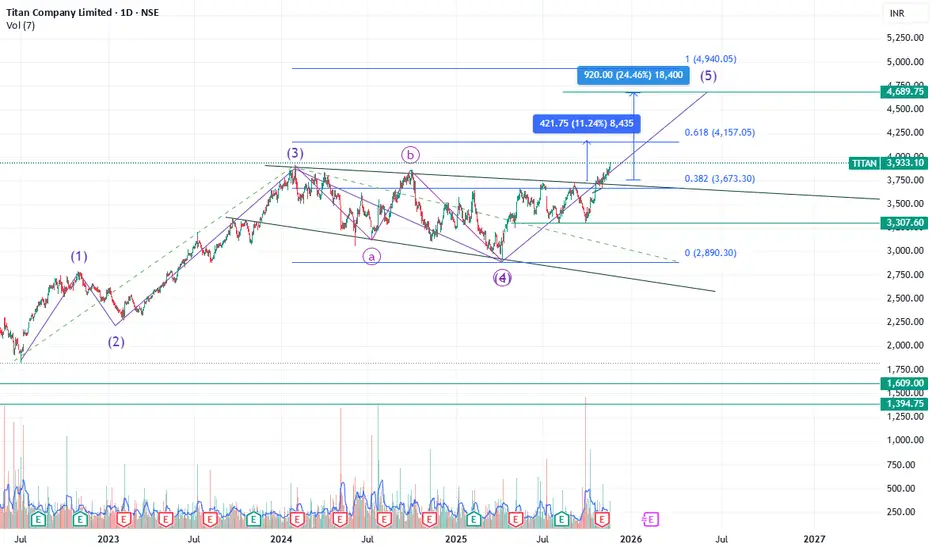
• Elliott Wave Count (1–5)
• A complete ABC correction for Wave 4
• Breakout from a long consolidation
• Fibonacci retracement projections
• Targets for Wave (5)
Below is the breakdown:
________________________________________
🔵 1. Elliott Wave Structure
Wave (1) → Wave (2)
• The early impulse and correction are visible on the left side.
Wave (3)
• A strong rally into mid-2024 (peak marked as (3)).
Wave (4) – ABC Completed
• Wave a drops sharply.
• Wave b retraces upward.
• Wave c makes a final low forming Wave (4).
• The bottom of Wave (4) lies near ₹2,900–3,000 (0% level shown).
This confirms Wave (4) completed.
________________________________________
________________________________________
🔵 2. Price Targets for Wave (5)
You have two targets highlighted:
📌 Short-term breakout target-1
• ₹4,165 (11.24%)
• Label shows a smaller measured move, possibly from breakout box height.
📌 Major Wave (5) Target-2
• ₹4,689 (24.46%)
• Calculated as the height of previous swing projected from breakout.
This aligns with Elliott Wave rules where:
• Wave 5 often equals Wave 1 OR 0.618 × Wave 1
• It usually surpasses Wave (3)'s high
Wave (3) high ≈ ₹4,050
So the ₹4,689 Wave (5) target fits perfectly.
Your updated chart combines:
• Elliott Wave Count (1–5)
• A complete ABC correction for Wave 4
• Breakout from a long consolidation
• Fibonacci retracement projections
• Targets for Wave (5)
Below is the breakdown:
________________________________________
🔵 1. Elliott Wave Structure
Wave (1) → Wave (2)
• The early impulse and correction are visible on the left side.
Wave (3)
• A strong rally into mid-2024 (peak marked as (3)).
Wave (4) – ABC Completed
• Wave a drops sharply.
• Wave b retraces upward.
• Wave c makes a final low forming Wave (4).
• The bottom of Wave (4) lies near ₹2,900–3,000 (0% level shown).
This confirms Wave (4) completed.
________________________________________
________________________________________
🔵 2. Price Targets for Wave (5)
You have two targets highlighted:
📌 Short-term breakout target-1
• ₹4,165 (11.24%)
• Label shows a smaller measured move, possibly from breakout box height.
📌 Major Wave (5) Target-2
• ₹4,689 (24.46%)
• Calculated as the height of previous swing projected from breakout.
This aligns with Elliott Wave rules where:
• Wave 5 often equals Wave 1 OR 0.618 × Wave 1
• It usually surpasses Wave (3)'s high
Wave (3) high ≈ ₹4,050
So the ₹4,689 Wave (5) target fits perfectly.
Thông báo miễn trừ trách nhiệm
Thông tin và các ấn phẩm này không nhằm mục đích, và không cấu thành, lời khuyên hoặc khuyến nghị về tài chính, đầu tư, giao dịch hay các loại khác do TradingView cung cấp hoặc xác nhận. Đọc thêm tại Điều khoản Sử dụng.
Thông báo miễn trừ trách nhiệm
Thông tin và các ấn phẩm này không nhằm mục đích, và không cấu thành, lời khuyên hoặc khuyến nghị về tài chính, đầu tư, giao dịch hay các loại khác do TradingView cung cấp hoặc xác nhận. Đọc thêm tại Điều khoản Sử dụng.