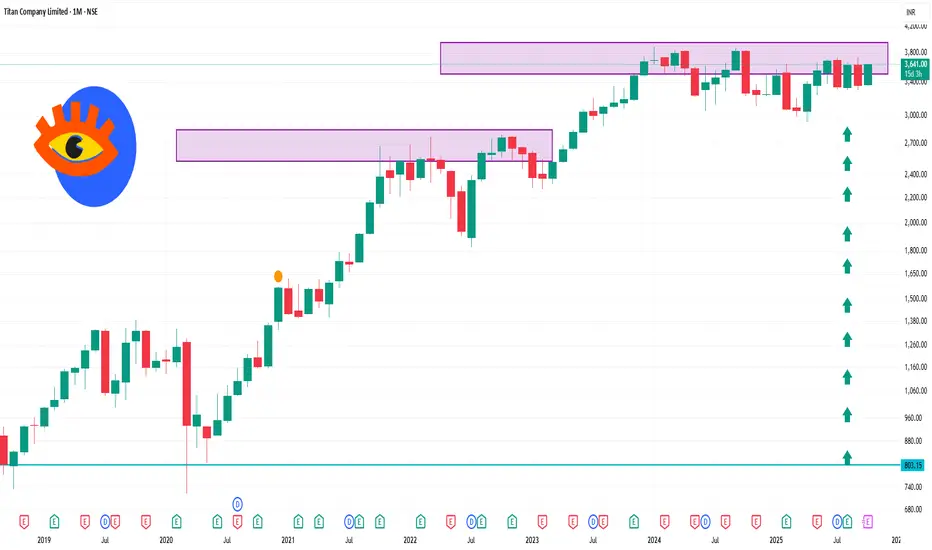
Titan Company Ltd is trading near ₹3,636.50, approaching its 52-week high of ₹3,740.
📊 1-Month Technical Overview
Price Performance: The stock has seen a modest decline of approximately 0.20% over the past month.
Technical Indicators:
Relative Strength Index (RSI): The RSI is currently in the neutral zone, indicating balanced buying and selling pressures.
Moving Averages: The stock is trading above its short-term moving averages, suggesting a positive short-term trend.
Stochastic Oscillator: The stochastic indicator is in the bullish zone, indicating potential upward momentum.
Commodity Channel Index (CCI): The CCI is above zero, signaling a bullish trend.
Rate of Change (ROC): The ROC is positive, further confirming bullish momentum.
Money Flow Index (MFI): The MFI is above 50, indicating healthy buying activity.
Support and Resistance Levels:
Support: ₹3,189.25
Resistance: ₹3,559.25
Bài đăng liên quan
Thông báo miễn trừ trách nhiệm
Thông tin và các ấn phẩm này không nhằm mục đích, và không cấu thành, lời khuyên hoặc khuyến nghị về tài chính, đầu tư, giao dịch hay các loại khác do TradingView cung cấp hoặc xác nhận. Đọc thêm tại Điều khoản Sử dụng.
Bài đăng liên quan
Thông báo miễn trừ trách nhiệm
Thông tin và các ấn phẩm này không nhằm mục đích, và không cấu thành, lời khuyên hoặc khuyến nghị về tài chính, đầu tư, giao dịch hay các loại khác do TradingView cung cấp hoặc xác nhận. Đọc thêm tại Điều khoản Sử dụng.