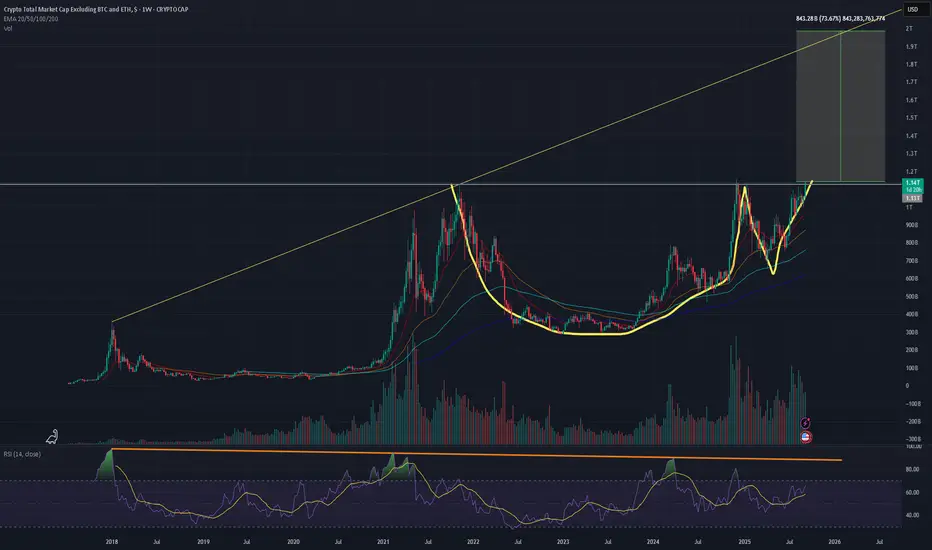
The total3 chart printed a high timeframe cup and handle formation and it looks like a breakout is imminent, but we could get some sideways action for a few weeks as well.
The measured move from this formation takes the market cap to $2 trillion, which looks like it will align with the ATH trendline, assuming the pump peaks in 3-6 months.
The BTC.D chart is breaking down as well which is a great sign.
My main concern is the USDT.D chart that's approaching strong support. Will that support stall alt season or stop it entirely? I think there's enough bullish signs to create the momentum that'll make this alt season take off.
Boost this post if you found it helpful.
Thông báo miễn trừ trách nhiệm
Thông tin và ấn phẩm không có nghĩa là và không cấu thành, tài chính, đầu tư, kinh doanh, hoặc các loại lời khuyên hoặc khuyến nghị khác được cung cấp hoặc xác nhận bởi TradingView. Đọc thêm trong Điều khoản sử dụng.
Thông báo miễn trừ trách nhiệm
Thông tin và ấn phẩm không có nghĩa là và không cấu thành, tài chính, đầu tư, kinh doanh, hoặc các loại lời khuyên hoặc khuyến nghị khác được cung cấp hoặc xác nhận bởi TradingView. Đọc thêm trong Điều khoản sử dụng.